Updated 7/12/2023
Let’s assume you are an absolute beginner when it comes to using ticker systems like Yahoo Finance. The world of stock investments might seem confusing and overwhelming, with plenty of symbols and slang.
Don’t worry. I’ve broken down the basics to the stock market before, with my beginner’s guide having been viewed over 100,000+ times, and I’ll do the same for the standard Yahoo finance interface.

I’m going to go through each individual category and explain exactly what each of the abbreviations means.
Getting Started: Using Yahoo Finance (Example)
Now the first thing you’ll see when you enter Yahoo finance’s main page is a search bar at the top, and then a convolution of charts, ads, video links, article links, broker ads, games ads… the list goes on. That top search bar is going to be the place where you’ll find the most use and get the most data for stock market investing.
Every stock that is publicly traded will have its own ticker symbol. This symbol holds the key to all of the charts and data behind that stock.
For this how-to guide, we’re going to use the ticker for the biggest stock in the market right now, Apple Inc (AAPL).
When we type AAPL into the search bar, a myriad of data immediately hits our screen. If you are following along, it should look like this:
Right away, there’s a big number in bold. That’s the current price of the stock.
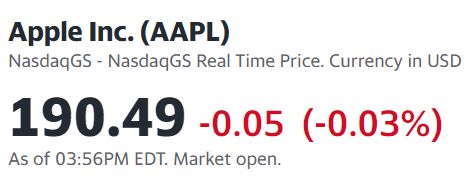
In smaller numbers and in either red or green color is the difference in the stock price for today. You’ll see, in this order, an arrow going up for gain and down for loss, the amount of dollar value ($) gained or lost for the day, and the percentage of that difference compared to the price.
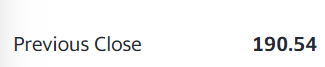
Next, we have the Previous Close. This is pretty straight forward as the previous close value. The previous close is the price of the stock when the market closed yesterday.
Keep in mind throughout this guide that the market hours for US exchanges such as the NYSE are 9:30am EST- 4:00pm EST. Other markets in other countries and time zones operate on their own schedule. As an investor, you can technically put in a trade at any time in the after hours.
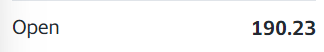
The Open is the price of the stock when the market opened on this day.
Now getting technical with the nuts and bolts behind the stock price, we have the bid and the ask.
The bid is the highest price a potential stock purchaser is willing to buy the stock at, and at that particular quantity. It’s the broker’s job (like Ally or Merrill Lynch) to match new clients’ transactions with bids or asks.
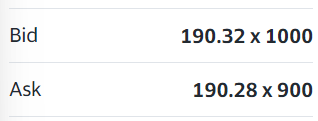
The ask is similar to the bid but is just the opposite. The ask is the lowest price a stockholder is willing to sell his stock for.
In both the bid and the ask, buyers and sellers of the same stock are competing with each other and essentially lining up orders for the brokers to fill. It works almost like an auction market would, with the best price on either side of the bid or ask skyrocketed to the top.
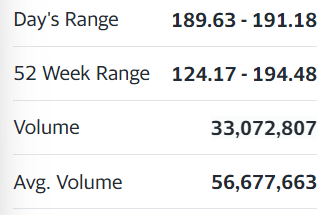
The next sections– Day’s Range, 52 Week Range, Volume, and Avg. Volume– tell you the ranges that the stock has traded in the given time period, and how many shares have traded hands today (Volume) and on average (Avg. Volume).
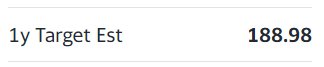
Next, on the bottom right we have the 1y Target Est. Again, this is a straightforward definition. 1 year target estimate is simply the price that analysts have predicted the stock will be one year from now.
The reliability behind these estimates are the true question here. The way I see it, the accuracy of an estimate has the same chance as any other estimate. It really is a 50-50 guess, and the stock could easily beat the estimate just as easily as fail the estimate.
The game of prediction is a fickle one. Forecasters are wrong just as much as they’re right when it comes to the weather, and they even have the luxury of technology giving us 12 hour lookbacks and predictive wind patterns. Sports forecasters are just the same. An estimate is as good as its analyst, and for the finance sites it could be anyone.
Yet when I’m looking at a stock that I’ve already deemed favorable… I’ll admit I take a favorable target estimate in a positive light.
Beta
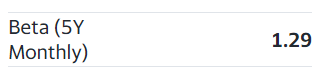
This next number I want to highlight has to do with an advanced financial topic called volatility. Basically volatility measures how much movement a stock has gone through in its recent history. [When talking about recent history with stocks, it usually means 1 month, 3 months, 6 months, 1 year, 2 years, 5 years or 10 years].
A stock with much more buys than sells, or sells than buys, will have a higher volatility than a stock that has stayed relatively unmoved. Beta comes into the equation when you want to compare a stock’s volatility to the average of the market.
A stock with a beta of 1 is moving at the same volatility as the market. A stock with a beta greater than 1 is moving with greater volatility than the average, and a stock with a beta less than 1 has less volatility than the average.
To read more about how beta drives stock valuation, click on this link.
The next metric to highlight on this column for Yahoo Finance is the next earnings release date. Earnings releases are important for two reasons.
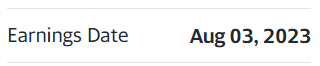
Number one, this is when the performance of a company is evaluated. Results are compared to estimates, and the stock price will move based on this data.
Secondly, new estimates are released on this day as well. When estimates guide lower, a more bearish sentiment surrounds the stock on the street. Of course, estimates guiding higher show a general abundance of earnings and can mean well for the stock moving forward.
You’ll tend to see a good amount of movement in the share price around earnings time. The caveat is that sometimes these movements are purely irrational. Meaning the stock could be crashing lower or surging higher regardless of the logic. Something to keep in mind for the investor out there.
The company’s ex-dividend date, or date preceding that an investor needs to hold the stock by to receive its dividend (usually the day before the ex-div), tends to either be announced around the earnings release. Keep that in mind as well.
Next let’s look at Market Cap, which is short for market capitalization. Market capitalization is the total size of a company in the stock market. It represents how many people own shares in the stock market, and moves up as the share price moves up.
Market capitalization is an easy calculation. It is the number of shares outstanding multiplied by the share price of a stock. For example, if there are 100 total shares of a company on Wall Street, and the company is trading at $5 a share, the market cap would be $500.
To read more about market capitalization, check out this informative guide on it.
Besides market cap, the P/E is another standard measuring tool. P/E (TTM) refers to the P/E of the Trailing Twelve Months.
P/E stands for Price to Earnings, and is calculated by dividing Earnings by a stock’s share Price.
P/E is an extremely useful tool because it reflects the market sentiment surrounding a stock. Generally, a stock with a low P/E isn’t as favored by the market as a stock with a high P/E.
It makes sense if you think of it too. A stock with a higher price will have this characteristic because many people want to buy the stock. Thus, this higher price moves the P/E up.
However, the P/E can also be helpful in finding a company doing very well in the marketplace. Looking at the earnings side of the equation, a company with higher earnings will drive the P/E lower because holding price constant, higher earnings means a lower P/E.
P/E is really just the start of a much longer discussion into analyzing a stock. Once you can begin to understand the working behind the Price to Earnings ratio, you can rely that knowledge into understanding a company’s balance sheet, income statement and cash flow statement.
If you’re interested in attaining this knowledge, you can start with my easy 7 Steps to Understanding the Stock market guide, first with the P/E ratio.
EPS (TTM)
EPS (TTM) is another income statement analysis tool. It stands for earnings per share of the trailing twelve months, and it works as a good marker for how successful a company is doing.
While the earnings part of P/E refers to the total earnings of a stock, EPS allows the investor to compare earnings to each individual share.
It also lets the investor calculate P/E ratio by using the share price. It looks like: Price (by share) / Earnings (by share) or EPS.
To really get a good grasp on the concept of EPS, I highly recommend reading through the 7 steps guide.
Finally, we have dividend and the yield percentage. This tells us how much dividends we will receive per share we purchase. The yield tells us what percentage of a company’s share price the dividend comes out to be.
When it comes to investing in dividends, it’s important to remember that the yield isn’t what’s all that important and profitable in a dividend investment strategy. It’s the growth of that dividend over many years that makes an initial investment very profitable as the years go on.
I want to commend you for completing this guide. Hopefully it has done its part in decoding the sometimes challenging stock market numbers behind popular websites like Yahoo finance.

Andrew Sather
Andrew has always believed that average investors have so much potential to build wealth, through the power of patience, a long-term mindset, and compound interest.
