Updated – 11/3/23
A factor in the stock market is a set of characteristics, or style, of a group of stocks. Factor ETFs allow investors exposure to different stock market styles. At any time, some stock market factors will outperform, while others underperform.
Buying factor ETFs can be a great tool in managing a portfolio. It gives an investor a chance to participate in the outperformance of a stock market factor without having to pick individual stocks.
In today’s post, we will cover:
- Intro to Stock Market Factors
- Value and Growth Factors: $IUSV, $IUSG
- Quality Factor ETF: $QUAL
- Low Volatility Factor ETF: $USMV
- High Dividend Yield ETF: $VYM
- Momentum Factor ETF: $MTUM
- Dividend Growth ETF: $DGRO
- Equal Weight Factor ETF: $RSP
- Which Factors Will Perform the Best For Me Moving Forward?
Staying alert to the recent performance of various factor ETFs can be a great tool in understanding what type of market we have seen lately and what type of market we are currently in. This can sometimes help us ground our feelings with some context.
Sometimes it is not the skill level of a portfolio manager but rather his/her exposure to a stock market factor which has driven their recent performance compared to the average.
Intro to Stock Market Factors
The performance of stock market factors tends to move in cycles, similar to the way that the stock market itself moves in cycles. A factor outperforming in one cycle can tend to underperform significantly in the next, and vice versa. We will discuss ideas around the performance of factors later.
To start, here are the 8 main U.S. Equity Factor ETFs, as defined by Seeking Alpha:
- Value = $IUSV
- Growth = $IUSG
- Quality = $QUAL
- Low Volatility = $USMV
- High Dividend Yield = $VYM
- Momentum = $MTUM
- Dividend Growth = $DGRO
- Equal Weight = $RSP
What’s nice about the Seeking Alpha website is that they present the recent performance of these factor ETFs on their homepage, which looks like this:
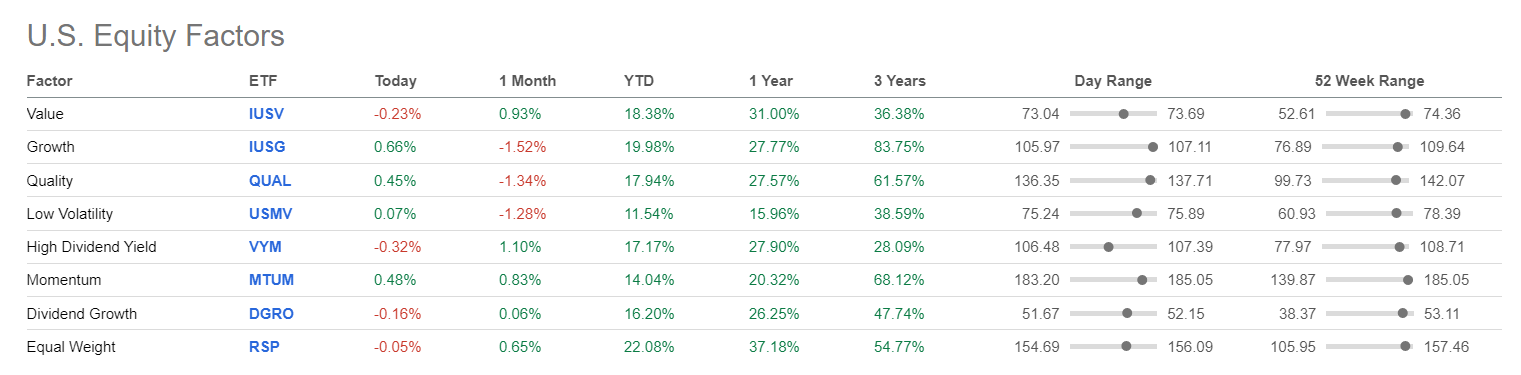
When the media claims that growth investing has been outperforming value investing, or that “quality” has been beating “high dividend yield”, you can check their claims by looking at the performance of these ETFs compared to the market and the other factors.
Let’s break down each of these major factor ETFs and their components.
Value and Growth Factors: $IUSV, $IUSG
The value factor refers to “value investing”, which is a type of stock market style wherein investors buy stocks with lower prices compared to their fundamentals. This is usually defined as a low price compared to a company’s earnings, free cash, sales, book value, or any similar fundamental metric found in a company’s financial statements.
One of the most popular Value ETFs is the iShares Core S&P U.S. Value ETF or ticker symbol $IUSV. Like other iShares ETFs, this ETF is managed by BlackRock.
$IUSV draws from a diversified set of sectors and sizes, and is meant to track the S&P 900 Value Index.
The S&P 900 Value Index measures whether a stock is a value stock or not with three factors:
- Price to Sales (P/S)
- Price to Book Value (P/B)
- Price to Earnings (P/E)
Interestingly, a stock can be both in the S&P 900 Value Index and the S&P 900 Growth Index, depending on how they “rank” on growth and value scores.
Refer to the official document from S&P Global for the methodology behind these style indexes, but here’s the gist, as described by a couple of useful diagrams:
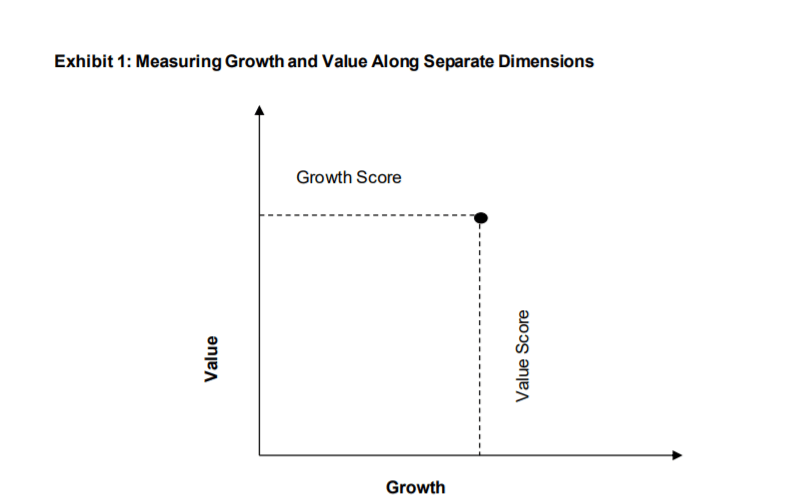
The weight of a stock’s “value score” will depend on how it ranks on the three primary factors identified above.
A stock will also get a “growth score”, dependent on these three factors:
- 3-year Net Earnings per Share change vs Current Price
- 3-year Sales per Share growth rate
- 12-month % price change in Momentum
Once a stock in the sample set (which includes the S&P 500 and S&P 400) is ranked with a growth score and value score, they are compared against all other stocks in the sample set as sorted between the formula: (Growth Rank/ Value Rank). Like so:

The 33% on the top and bottom are pure plays and added to their respective indices, whether the S&P 900 Value Index or S&P 900 Growth Index.
But, 34% of stocks in the blended middle are included in both indexes. What the methodology states is that a mid-point is determined, and the float-adjusted market capitalizations of each stock is distributed to each growth and value index, depending on how far away from the midpoint they are.
So a stock that is maybe “51% value/ 49% growth” would see something like 51% of its market capitalization-weighted in the value index and 49% in the growth index.
The S&P 900 Value index is rebalanced quarterly in March, June, September and December. As of September 30, 2021, the index included 739 constituents with a market capitalization of over $26T.
The S&P 900 Growth Index is also rebalanced quarterly in March, June, September and December. As of September 30, 2021, the index included 474 constituents with a market capitalization of over $27T.
Note that the “Pure Growth” and “Pure Value” styles offered by S&P Global are not categorized by the same blended methodology above and contain different constituents.
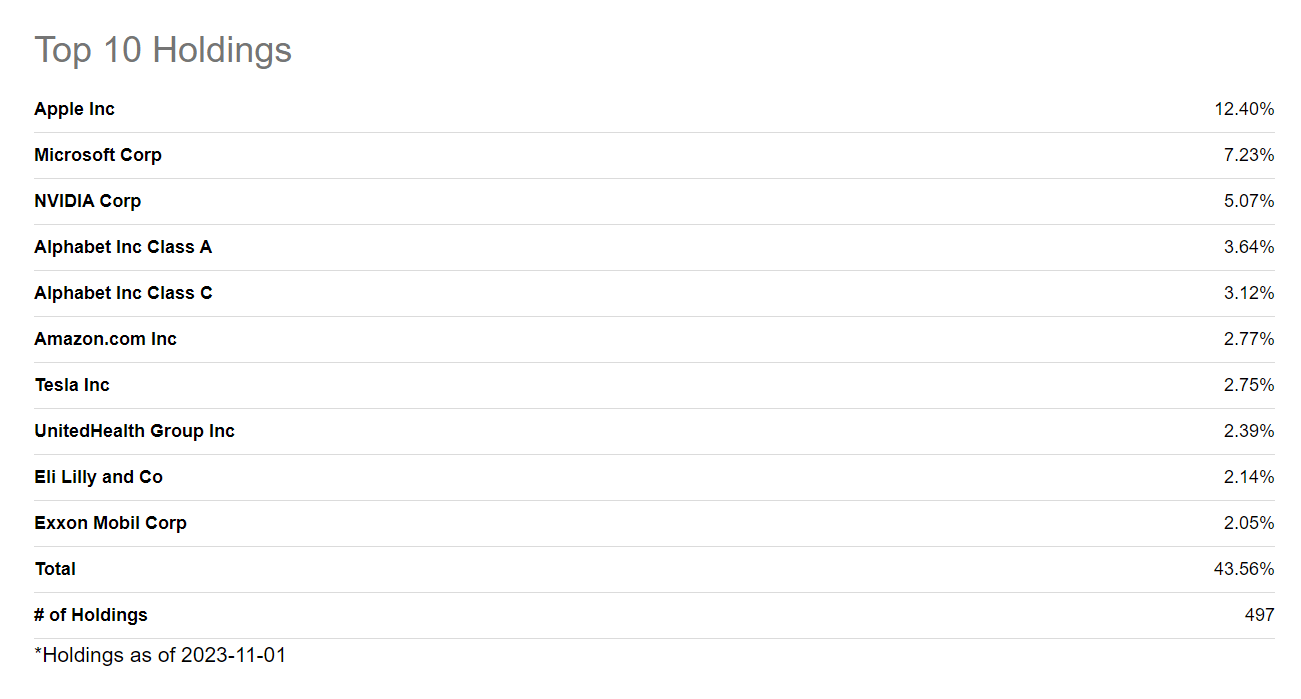
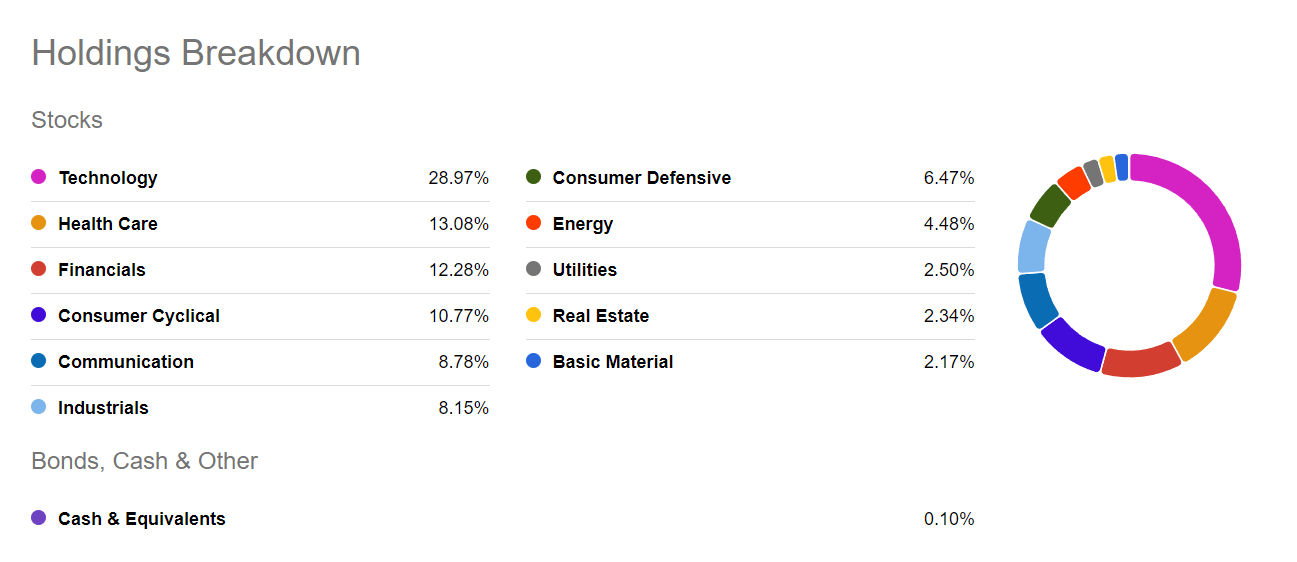
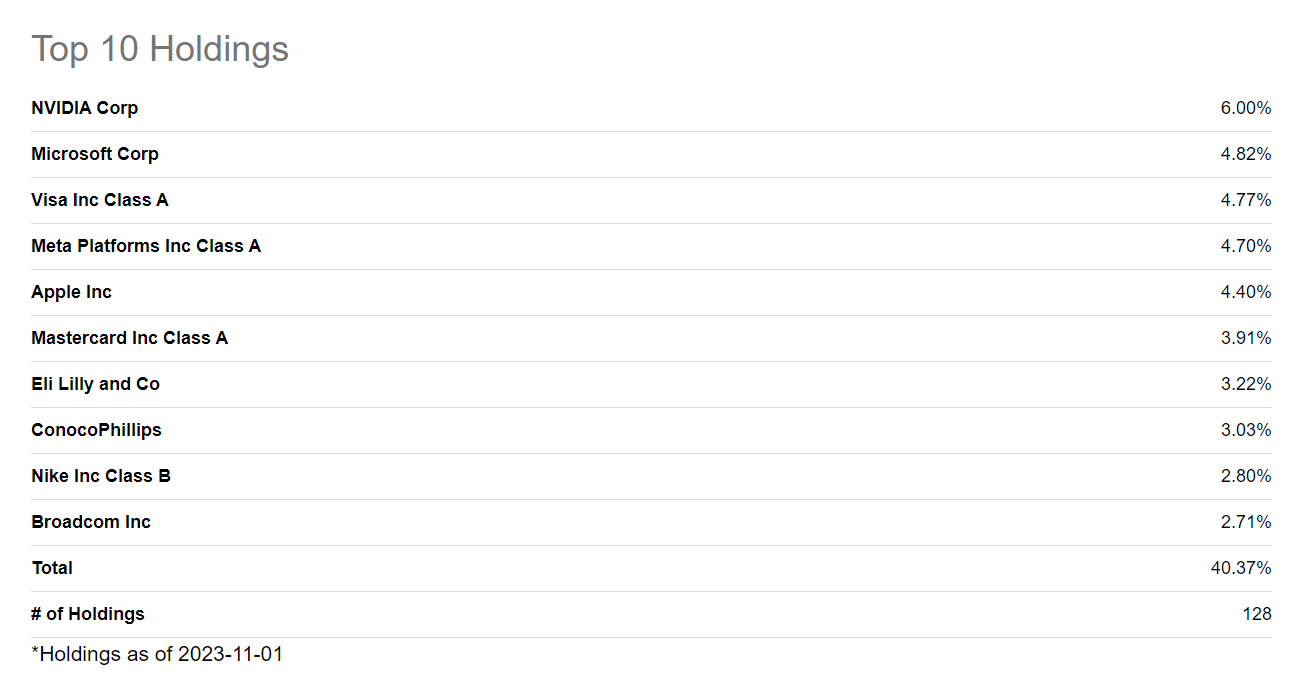
To give you an example of each of the constituents for the indexes, here’s the list of top 10 Constituents by Index Weight for the iShares Core U.S. Growth ETF, ticker $IUSG, (as reported by Seeking Alpha), which tracks the S&P 900 Growth Index:
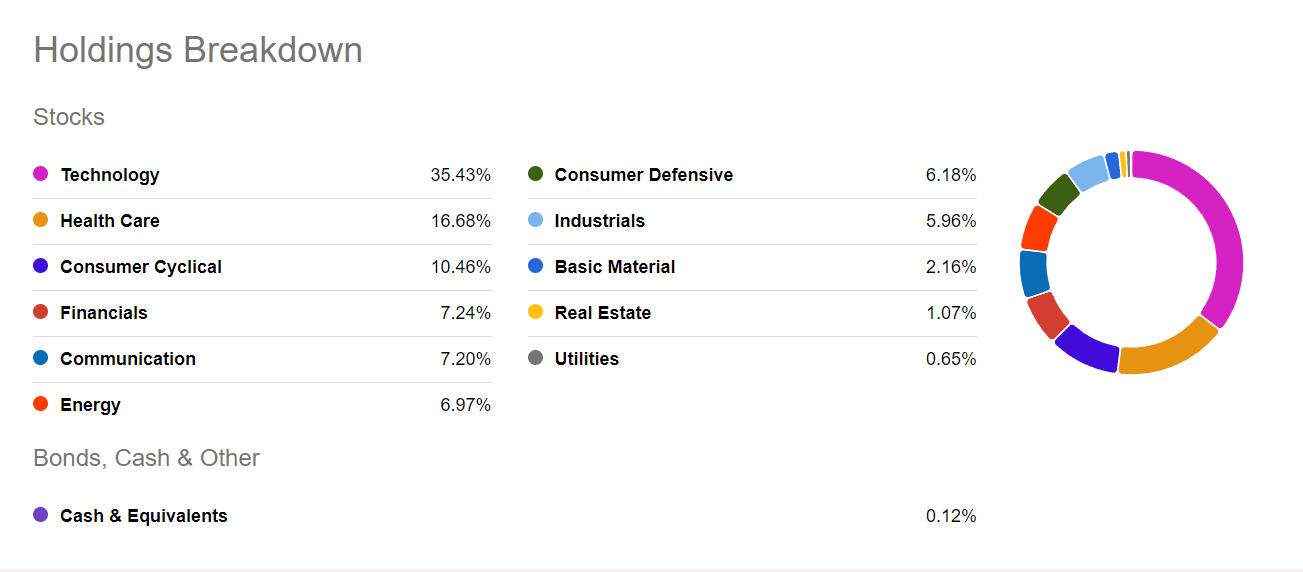
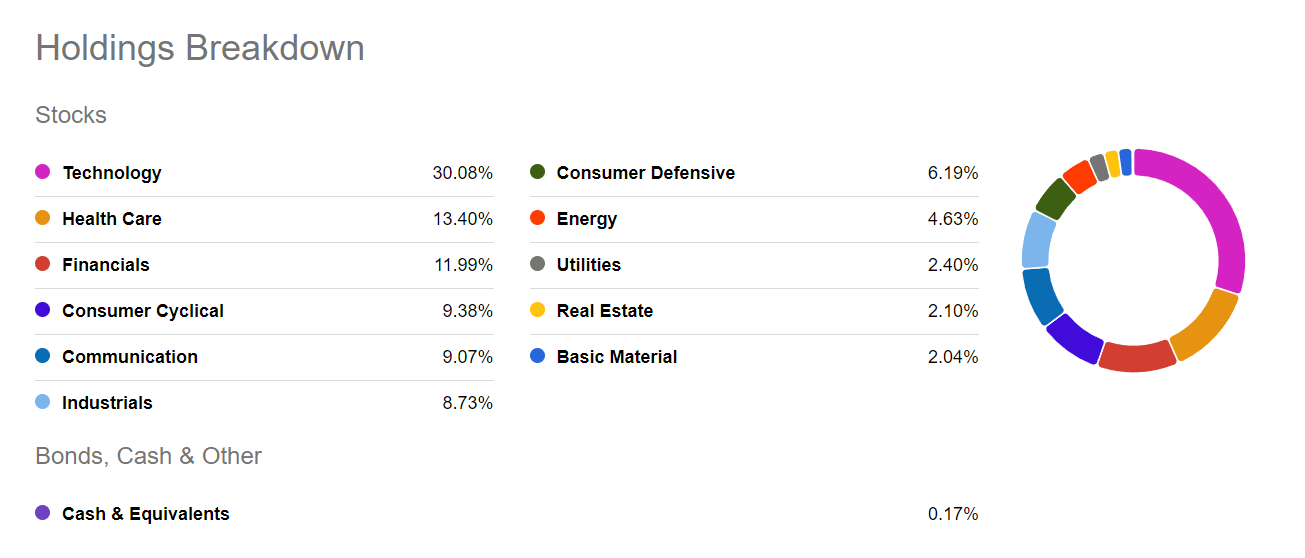
The breakdown of holdings by industry is also reported by Seeking Alpha as of the time of this writing and displayed nicely here:
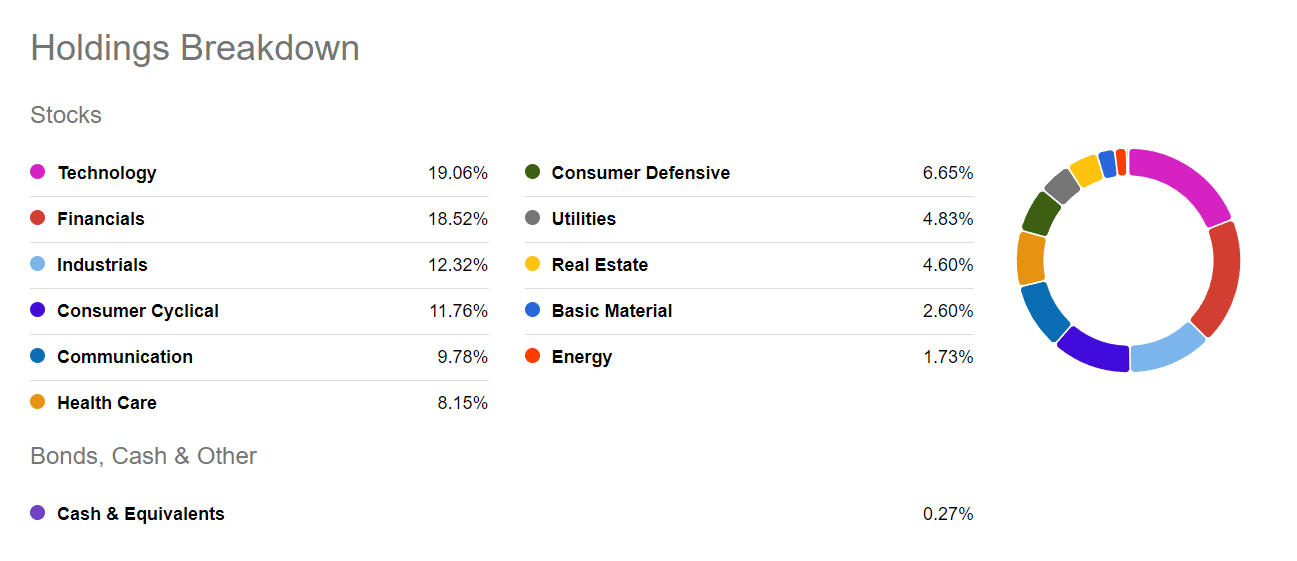
The Value factor ETF $IUSV has a much different constituent base and industry weightings:
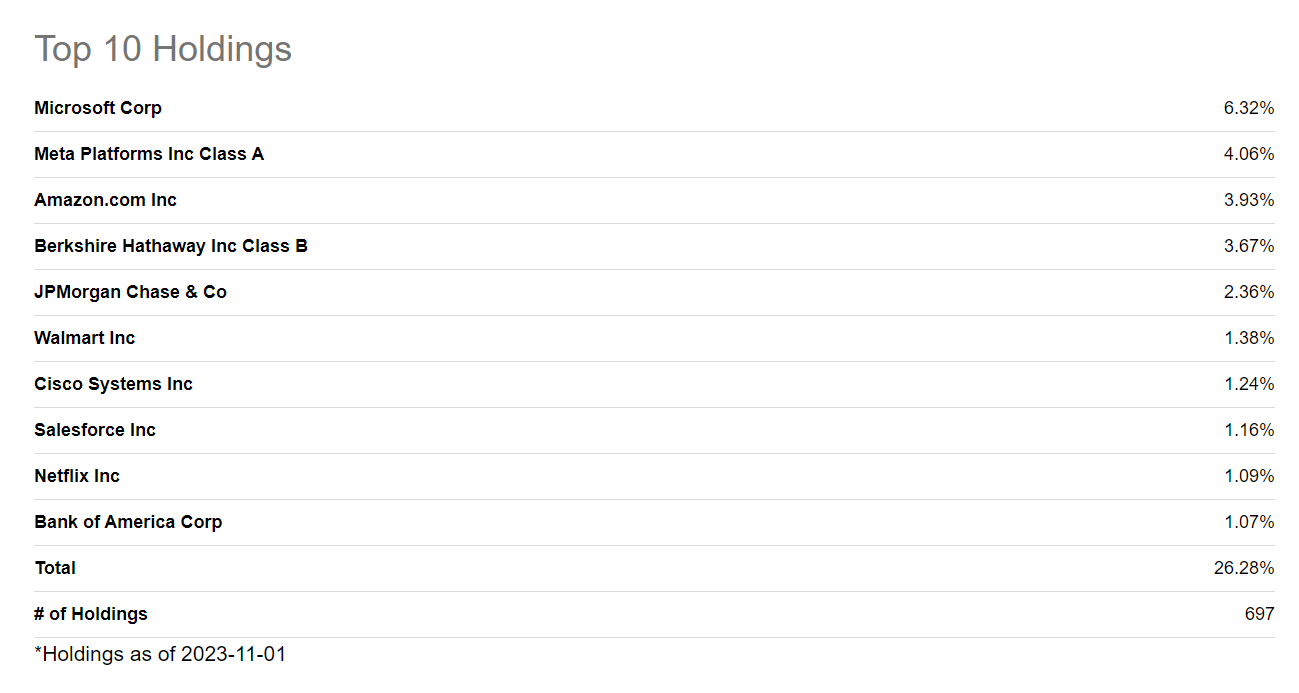
The industry weighting breakdown has a much different look, dominated today by financials and technology:
For fun, we can compare both of these factor ETFs’ industry weightings to the overall S&P 500 index, which is the benchmark for many average and professional investors:
But by far the biggest difference in weightings between the two factor ETFs, growth and value, is the exposures to technology and financials, with large differences between the two.
Quality Factor ETF: $QUAL
This is another iShares factor ETF with its own specific criteria. According to BlackRock’s iShares website (recent annual report), the iShares MSCI USA Quality Factor ETF, ticker $QUAL adds constituents based on the MSCI USA Sector Neutral Quality Index.
According to MSCI, this index is comprised with stocks scoring higher on the following three main fundamental variables:
- High Return on Equity (ROE)
- Low leverage
- Low earnings variability
Like the other factor ETFs mentioned already, this index mainly comprises large and mid-cap stocks. You can read about the index fully here, with links included for the specific methodology for determining the index.
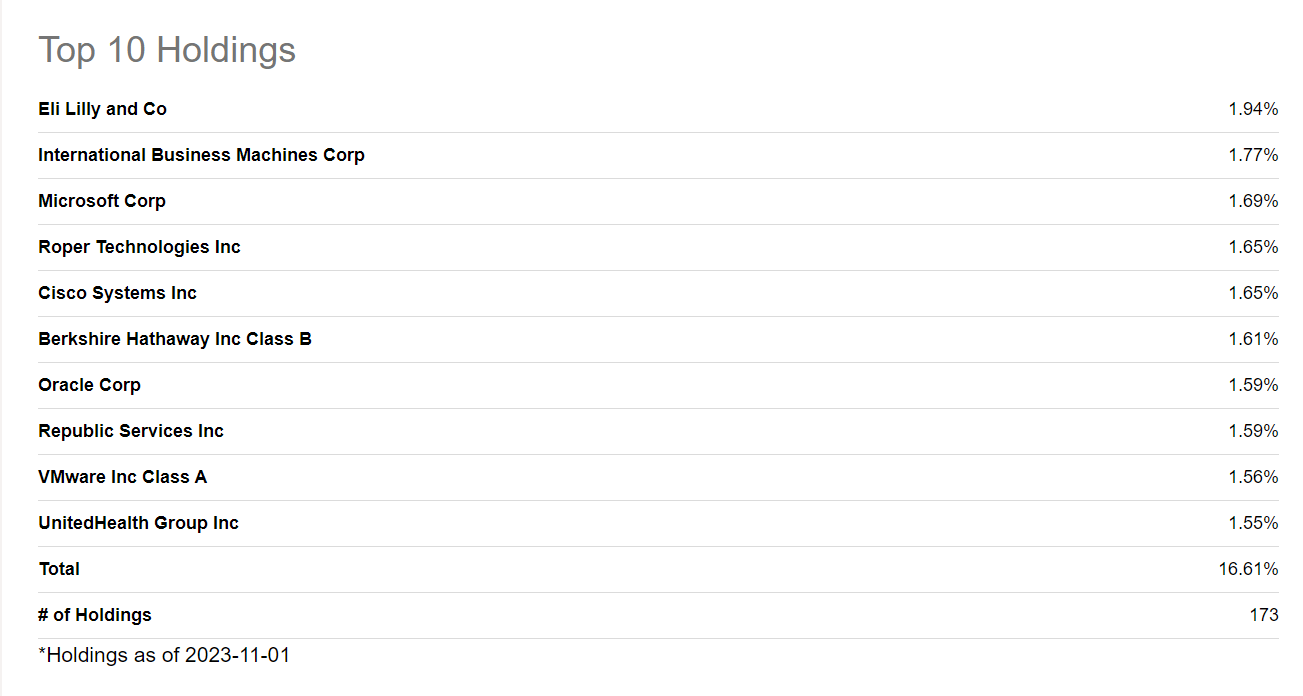
The top 10 holdings for $QUAL at the time of this writing include the following:
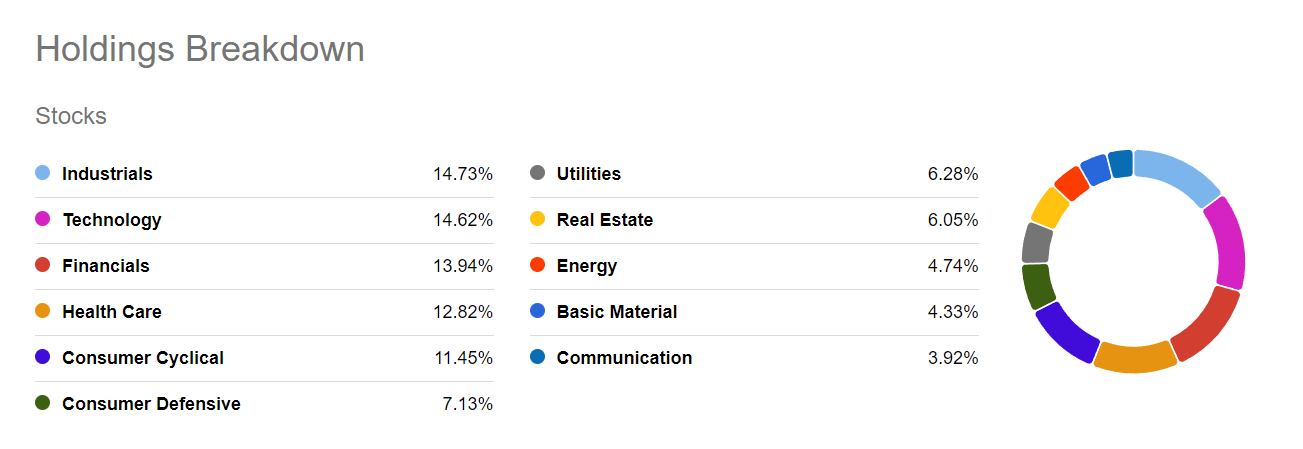
The industry weightings for $QUAL according to Seeking Alpha:
Low Volatility Factor ETF: $USMV
The next factor on our list is the iShares Edge MSCI Min Vol USA ETF, ticker $USMV. BlackRock reports that the objective of this ETF is to find stocks with lower volatility compared to the rest of the U.S. equity market.
The idea is that a basket of stocks like these are potentially lower risk than the rest of the stock market. The index used for this ETF is the MSCI EAFE Minimum Volatility (USD) Index, with its own set of constraints that you can find more information about from MSCI here.
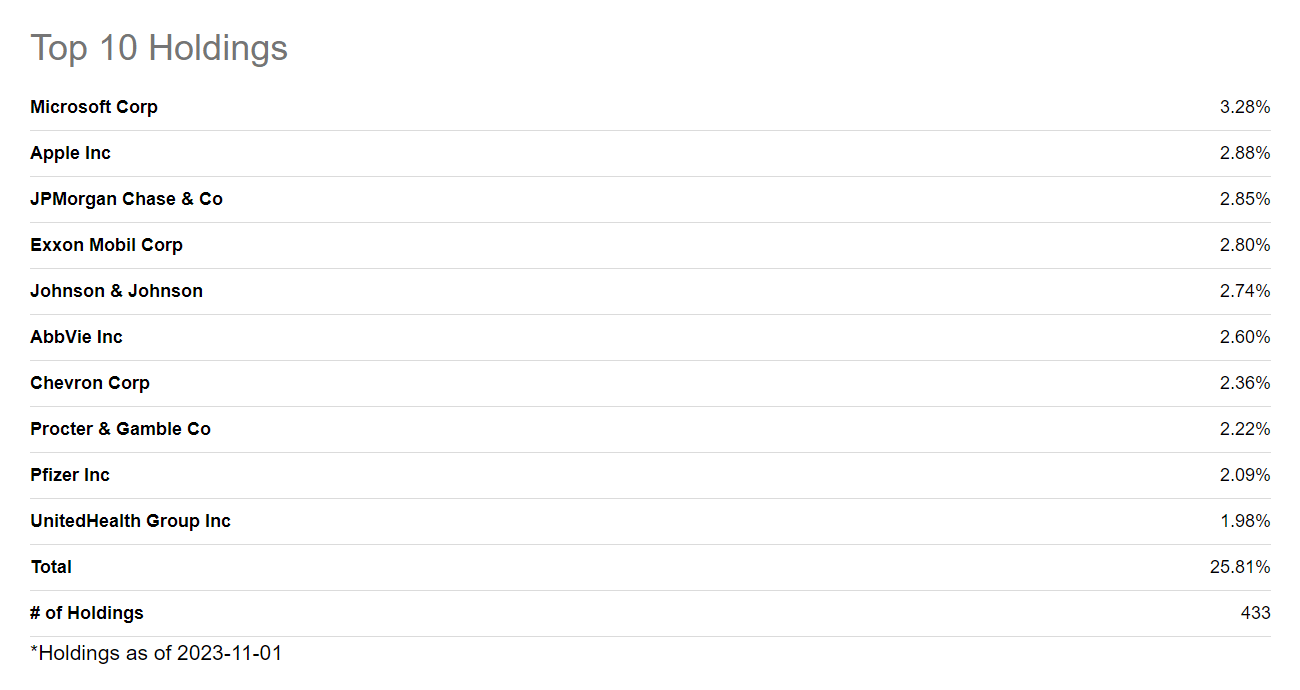
The top 10 constituents for $USMV at this time are the following:
High Dividend Yield ETF: $VYM
For investors looking for exposure to high dividend yielding stocks, the Vanguard High Dividend Yield ETF, ticker $VYM, can be a great option. As I write this the TTM (trailing twelve months) Yield for buying the ETF today is 2.77%, which is a good spread compared to the ETF tracking the S&P 500, ticker $SPY, trading with a TTM dividend yield of 1.27%.
According to Vanguard, the fund looks to track the performance of the FTSE High Dividend Yield Index, which invests in stocks with higher than average dividend yields.
You can think of $VYM as a good representation of the “Large Value” factor, and Vanguard characterizes the fund as a 4 out of 5 for “more risk, more reward.”
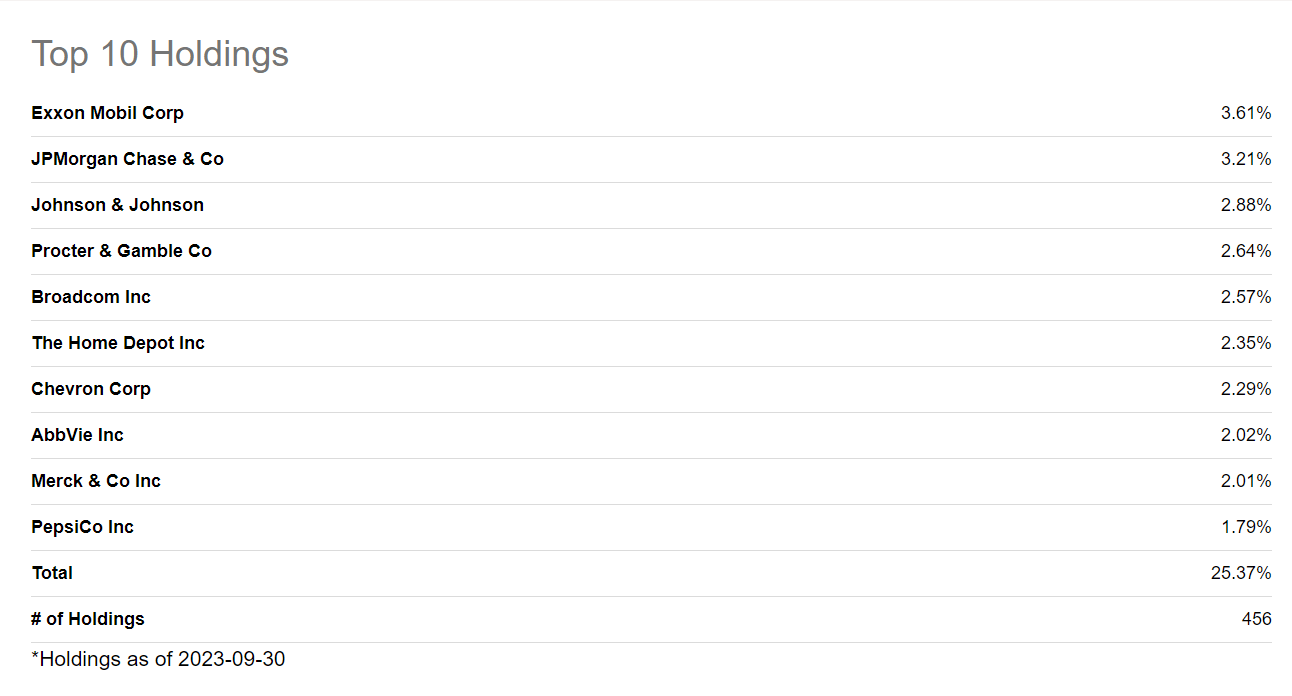
The top 10 constituents of $VYM according to Seeking Alpha today:
Momentum Factor ETF: $MTUM
This factor, like the low vol ETF, looks to track the performance of stocks and their prices in the market using “representative sampling technique”.
$MTUM looks to track the MSCI USA Momentum SR Variant Index, which is characterized by MSCI with the following rebalancing criteria:
“MSCI USA Momentum Index is rebalanced by first determining a 6-month and 12-month standardized risk adjusted momentum value for each stock in the MSCI USA Index by adjusting stock’s recent 12-month and 6-month excess local price performance using its volatility and standardizing the result.”
This creates a “momentum score”, which will then be compared to all other stocks in the MSCI parent index with about 30% of the top ranking stocks included in this momentum index.
The index experiences moderate index turnover, and so its constituents are likely to change much more frequently than some of the other factor ETFs out there.
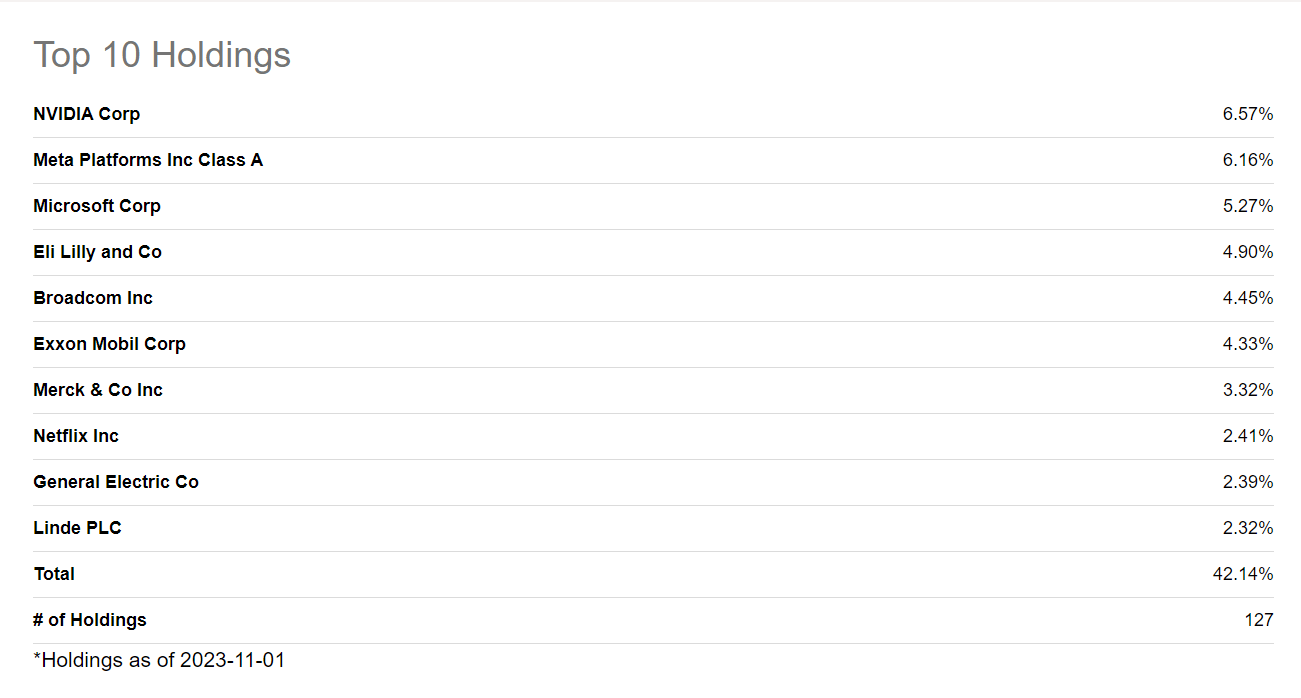
As of today, $MTUM contains stocks which you might not think of as common “momentum” names, but are the stocks which have been performing very well lately:
This momentum ETF can be a great indicator of stocks have been on hot streaks and been performing the best compared to the rest of the stock market.
Dividend Growth ETF: $DGRO
Like the way the ETF sounds, this factor looks to find stocks which pay nicely growing dividends. Buying this ETF today does not give you as much of a TTM yield as the high dividend yield ETF, but does provide a premium to the S&P 500’s current TTM dividend yield, with the $DGRO’s TTM yield currently at 2.01%.
This iShares Core Dividend Growth ETF, ticker $DGRO, looks to track the Morningstar US Dividend Growth Index, which looks to buy stocks with these characteristics:
- Pay Qualified dividends
- Minimum of 5 years of uninterrupted annual dividend growth
- “Have a significant margin to continue growing dividends”
The full construction rules for the Morningstar US Dividend Growth Index can be referenced here. The top 10 constituents of the index today are the following:
Equal Weight Factor ETF: $RSP
This last factor looks to track the performance of the S&P 500 but as if the index was equally weighted instead of market capitalization weighted.
In other words, each of the 500 companies are distributed equally in the portfolio.
The equal weight ETF tries to paint a picture of how the market as a whole is doing, rather than looking at the S&P 500, which can be heavily skewed based on the performance of its top constituents (in size).
$RSP is managed by Invesco Capital and tracks the S&P 500 Equal Weight Index. Its top 10 constituents are not noteworthy to display since the entire portfolio is supposed to have an equal weight. Instead, it is interesting to look at the breakdown between industries, which sheds light into how consolidated or fragmented certain industries appear to look (at least from an S&P 500 standpoint):
Which Factors Will Perform the Best For Me Moving Forward?
This tends to be the million-dollar question, right…
Investors want to know which factor is the better one for long-term investing, and the answer is that it really depends.
As I mentioned at the onset, factors go in and out of favor in the stock market. That’s just been a noticeable trend over the many decades of the stock market. Look no further than the “Nifty-Fifty” time period, where the 50 biggest stocks greatly outperformed the rest of the market. That was the “in” factor at the time.
However, like all hot factors, the Nifty-Fifty eventually faded away, and other factors took its place in leading the market performance.
Which factors will outperform at any given time can say a lot about the collective emotions of market participants at any given time.
Trying to time this would be a fool’s game.
That said, buying these factor ETFs to get exposure to these stocks over the long term might not be a great bet either. Since these ETFs are generally always rebalancing, they will not buy the stocks over the long term like you might have intended.
Say you wanted a portfolio of “Quality” names to buy and hold for decades. Buying the Quality ETF will give you the highest-ranked quality stocks at that time, but that list will change each quarter.
So you wouldn’t hold those quality names for decades, even though you might hold the ETF for decades.
In that case, it might make more sense to buy these stocks individually in your account and just hold them rather than be subject to the turnover that comes with these ETFs and their scheduled rebalancing periods.
One last word on which factor ETFs will outperform moving forward.
I listened to an interesting podcast episode on the Masters in Business Podcast with guest Harin de Silva talking about Portfolio Management.
Silva is an expert on stock market factors and had a fascinating discussion with Barry Ritholtz on the show.
A few things Silva mentioned which I thought stood out to me:
- Factors with great 1-year performance will tend to continue great performance over the short term
- Factors with great 3-year performance will tend to underperform over the upcoming short-to-medium term
Take those ideas with a grain of salt as I’m just relaying what I heard and did not do that research myself (and of course more details are depending on which study Silva was referring to).
That said, it does seem to make sense, reinforcing that idea about factors.
Factors go in and out of favor, and so keep that in mind as you are examining their performance.

Andrew Sather
Andrew has always believed that average investors have so much potential to build wealth, through the power of patience, a long-term mindset, and compound interest.
