The price we pay for investing in any particular company matters and the continuation of determining the fair value for any company is an ongoing process. Another tool we can add to our toolbox is the absolute PE model created by Vitaliy Katsenelson.
In the fantastic book, Active Value Investing, Vitaliy lays out his idea of adapting the PE ratio we are all familiar with in an aspect of using the model to value companies.
Most use the PE ratio in a relative manner, such that they compare one company’s PE to the others, and then base their valuation on that comparison. Vitality took it a step further and added additional ideas to the PE ratio in creating his model.
One of the problems with relative valuation, or comparing one company to another, is the issue of assigning a higher ratio to your company and deciding that is a more likely ratio for your company. All of which encompasses different biases, such as anchoring on the higher PE ratio and assigning more value to that than the real performance of your company.
Vitaliy understands those biases and attempts to circumvent those ideas using his absolute PE model.
In today’s post, we will learn:
- What is the Absolute PE Model?
- Five Principals of the Absolute PE Model
- Putting Together the Absolute PE Model with Examples
Ok, let’s dive in and learn more about the Absolute PE model.
What is the Absolute PE Model?
When valuing companies, the most common form of valuation occurs when analyzing the PE ratio of your company. The route most take follows:
- Compare our company’s PE to other competitors
- If the competitor’s PE is higher, we then assign that PE to our company and multiply that PE by our company’s earnings.
- Bingo! We can sleep better at night because it can justify the higher valuation based on the comparison to competitor’s PE.
For markets fairly valued on a relative basis, or for extremely cheap stocks, this type of comparison can work.
But markets today does not equal fairly valued, or do they rarely, and when markets are expensive such as today, this relative valuation method assigns the wrong multiple.
When markets are struggling, such as during recessions, if a quality company is trading at a PE of 5, most investors think there is something wrong with the company, and assign it a PE of 7, when in reality, it should have been 15.
In a situation where markets are rising, such as today, then the rising tide lifts all boats, and even terrible companies trade at high multiples.
As I mentioned above, these are all examples of anchoring bias in action.
Vitaliy’s absolute PE model takes a different tact with increasing or decreasing the PE based on the company’s fundamentals.
For example, if the company has great fundamentals, its PE will increase accordingly instead of comparing it to the competitors and justifying any increase based on the comparison. On the flip side, if the fundamentals of the company are poor, then the PE will slip accordingly.
The absolute PE model uses five conditions to arrive at the intrinsic value of any company.
- Earnings growth rate
- Dividend Yield
- Business risk
- Financial risk
- Earnings visibility
As with any valuation model, we are going to have to deal with subjectivity. Unfortunately, there is no model I am familiar with that doesn’t encompass subjectivity.
With Vitaliy’s model, we must understand the business and be able to assign a level of risk to investing in the company. Attempting to understand the risk level of any company is no easy task, and then assigning an increasing or decreasing premium for the company is not a simple process. But Vitaliy provides guides for his model that help make it possible and worthwhile to make an effort.
Ok, let’s break down the absolute PE model next and look at the five principles.
Five Principles of the Absolute PE Model
Vitaliy bases the model on five principle, and for us to put the model in action, we must understand those principle.
Before we put the model through its paces, let’s decipher the principles and understand the inner workings of the model before putting it to work.
Principle #1: Assigning a no growth PE as a starting point
Ben Graham, the father of value investing and the author of the Intelligent Investor, stated for him, a no-growth PE ratio he would assign to any company would be 8.5 for zero growth in earnings.
Graham included that PE in his seminal Graham’s formula to value companies. Vitaliy uses the PE of 8 for no growth companies, where one of my favorite authors, Jae Jun, uses seven. Based on what I have seen, any number between 7 to 8.5 range will work just fine for our model.
Remember that stock valuation encompasses aspects of subjectivity, and I am going to go with Vitaliy’s number as it is his model.
On an earnings yield basis, the PE of 7, if you flip it over, equals 14.2%, where the Graham and Vitality numbers of 8.5 and 8 equal 11.8% and 12.5%, respectively. All of the earnings yield respective the PE’s are good to me, thus why I am ok with working in the range of possibilities.
Principle #2: Understanding the relationship to earnings growth and PE
If you think about growth rates, logically, higher growth rates lead to a higher PE ratio. In fact, Peter Lynch assigned a relationship to make assessing growth and PE such that a PE of 12 meant a growth rate of 12% and a PE of 25 related to a growth rate of 25%.
Not a bad approximation but not realistic, depending on the market conditions.
To account for the vagaries of the market, the absolute PE model relates PE and growth in a non-linear fashion.
The organizing of the absolute PE model in a way such that for every percentage of earnings growth from 0% to 16%, the PE will increase by 0.65 percentage points, as opposed to 1 percentage point.
When the PE reaches a level of 17, the PE increases by 0.5 percentage points. The idea behind the graduated scale is the higher they fly, the harder they drop.
Below is a chart to help you see the relationship between growth and PE based on the book.
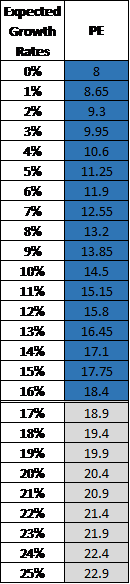
The above table highlights the expected growth rates, plus the related PE ratios assigned to those growth rates; also, the colored sections relate to the percentage points assigned to each level of growth. The first color is assigned 0.65 percentage points, and assigning the second color to 0.5 percentage points.
Notice there is a cap on the maximum growth at 25 percent, which means that companies such as Microsoft, with a current PE of 35, would be disqualified.
And high growth stocks such as Apple would currently be outside the realm of possibilities for this valuation tool.
Using the model means that during the valuation stage, we assign discounts or premiums based on the results of the company, not giving a discount or premium based on comparative results.
Which means that companies that exhibit better stability in earnings and growth will receive more points than others that are more unstable. A good way to think of it, the earnings visibility of a company such as Walmart and Target are going to be far more visible than, say, Salesforce, or Nvidia.
Principle #3: Dividends and Their Value
Dividends are a tangible return that all investors can see and touch, as we receive them as cold, hard cash unless you reinvest them. Where earnings are more opaque because they are something we don’t receive in any form.
Because the dividends are tangible, any company that issues dividends gets extra bonus points in the model.
In the model, every percentage of dividend yield equals one percentage point. That contrasts with the non-linear relationship of growth to PE, and if the dividend yield is less than 1 percent, it receives 0.5 points.
Below is a chart outlining the dividend and points assigned.
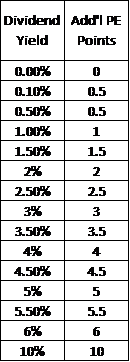
To help showcase how the chart works, consider Microsoft, which currently pays a 0.95% dividend yield. Therefore, Microsoft would receive an additional 0.5 points added to its PE. And likewise, Coca-Cola that Warren Buffett owns pays a dividend yield of 3.21%, would receive 3 points added to its PE.
We are moving on to the last two principals.
Principle 4&5: Business Risk and Financial Risk
Welcome to the subjective portion of the absolute PE model. In this section, much of your knowledge of the industry you are interested investing in comes into play.
Remember, when evaluating risk, we are all going to have different ideas of risk, and what is risky to me is not necessarily to you. I may penalize Microsoft for having more risk than you might, where you might assign more risk to Wells Fargo than I might based on our experience with the industry and our comfort level with any industry.
The bottom line, we need to assign a single number to represent a risk in the model.
It is the weakness of the model, but that is the tradeoff we make for the sake of simplicity. And no model is perfect; rather, it is the decisions we make that lead us to the final answers.
When considering business risk, we want to consider the industry, the products it produces, the life cycle, concentration of products and customers, and anything else associated with the operations of the business. That is where your knowledge of the industry will come in handy.
The level of financial risk is closely tied to the capital structure of the company, as well as the strength of the cash flow in relation to the debt and interest payments.
Additionally, we analyze the earnings visibility in the same way as analyzing both the business and financial risks.
The following are the risk points we use in the model:
- An average company is assigned a value of 1.
- For a market leader, assign a number less than 1.
- For a market lagger, assign a number larger than 1.
For more detail, the market leader is you feel it deserves a premium of 10%, then use a value of 0.9. Likewise, if a premium of 20%, then assign a value of 0.8.
In relation to a market lagger, the poorer company should receive a 20% discount, which means we assign a value of 1.2, and if the discount is 10%, then assign a value of 1.1.
A few other topics to discuss related to the model:
- Putting a Ceiling on growth – according to the model, additional PE points are assigned based on business, financial risks, and earnings visibility. For example, if the company has 10% earnings growth and doesn’t pay a dividend, the table assigns a PE of 14.5. And then, depending on the above facts, we would add or subtract points depending on its performance. Vitaliy writes that he limits the premium to the basic PE of no more than 30%. In other words, the highest our basic PE can rise is 18.85 (14.5 x 1.3 = 18.85). Or if the basic PE is 10, the highest it can rise is 13.
- Inflation and Interest Rates – Vitaliy’s model assumes that inflation and interest rates will remain “normal” and are not expected to rise or fall in dramatic ways. Currently, both inflation and interest rates remain low and are likely to continue in that vein in the near term. If either starts to rise dramatically, we must alter the basic PE to align with those increases or decreases.
Putting Together the Absolute PE Model with Examples
Ok, now that we have a good understanding of how the model works, let’s put it all together with a few examples.
The basic formula for the model before we dive in:
Absolute PE = Basic PE x (1 + (1-business risk)) x (1 + (1-financial risk)) x (1 + (1-earnings visibility))
Now, let’s work through the various stages of the formula and assign the different numbers.
For our guinea pig, I would like to use Microsoft (MSFT).
To get the basic PE for Microsoft, we look up the current PE and add any extra dividend points.
Microsoft currently has a PE of 36.60 and has a dividend yield of 0.95%, which earns Microsoft a bonus of 0.5.
The current PE of Microsoft stands at 37.1.
Looking at the business risk for Microsoft, we find that the company is a dominant force in the cloud computing business as it is ranked second in most polls when assessing the cloud business.
Some metrics you can analyze to assess the business risk:
- ROE – 40.16
- ROA – 15.43
- ROIC – 26.75
I would assign a Microsoft an above-average business risk premium of 0.4 to the base PE.
Assessing the financial risk for Microsoft is quite easy; they are incredibly strong across the board concerning metrics such as free cash flow, debt to equity, current or quick ratio, profit margins. All the above metrics for Microsoft grade out extremely well, and bankruptcy is not even a word in Microsoft’s vocabulary. I would assign Microsoft a premium of 9%.
Some metrics to help you assess the financial risk:
- Current Ratio – 2.52
- Quick Ratio – 2.49
- Debt to Equity – 0.6
Earnings visibility for Microsoft is incredibly strong as well; all the margins are strong, as well as earnings growth and free cash from operations. Based on these strengths, I would assign Microsoft a premium of 4%.
Some metrics to help you assess the earnings visibility:
- Gross margin – 67.78%
- Operating margin – 37.03%
- Net Margin – 30.96%
Now that we have all our numbers, let’s plug everything into the formula and see how our results turn out.
- Earnings Growth 36.60
- Dividend Yield (0.95%) 0.5 points
- Adjusted Base PE 37.1
- Business Risk 4% = (1-(1-0.96))
- Financial Risk 9% = (1-(1-0.91))
- Earnings Visibility 4% = (1-(1-0.96))
Now let’s plug all that into our formula.
Absolute PE = 37.1 x (1-(1-0.96)) x (1-(1-0.91)) x (1-(1-0.96))
Absolute PE = 37.1 x 0.96 x 0.91 x 0.96
Absolute PE = 31.11
The intrinsic value of Microsoft, according to our model, is $178.09, based on the TTM (trailing twelve months) numbers or $5.75 per share. To arrive at the share price, you multiply the earnings per share by the absolute PE to find your number.
According to our model, Microsoft is currently overvalued as the market price is $212.37.
Let’s try one more for giggles, shall we?
For our next round, I would like to examine Walmart (WMT). For this round, I will use our formula and plug in the values I think to represent the levels for Walmart.
- Basic PE 22.55
- Dividend Yield (1.52%) 1.5 points added
- Business Risk 0.96 premium
- Financial Risk 0.91 premium
- Earnings visibility 1.03
Absolute PE = 22.5 + 1.5 x 0.96 x 0.91 x 1.03
Absolute PE = 21.59
Now, let’s take the current earnings per share of 6.27 and multiply that by our absolute PE of 21.59, and we arrive at a value of $135.40, and when we compare it to the current market price of $141.44 and Walmart looks slightly overvalued based on our calculations.
Pretty easy, huh? Now it’s your turn to take this for a spin.
Final Thoughts
Valuation is part art, part science, and is arguably one of the more aspects to master involved in investing. The importance of the price you pay is paramount. If you overpay for a company, you limit the upside and longterm success of that investment; likewise, if the prospects for the company are poor, then paying too much can lead to permanent losses and the failure to heed Buffett’s first investing rule.
Vitality is one of the deepest thinkers and has deeply absorbed the ideas of both Graham and Buffett. The absolute PE model is a quick, easy method to determine the intrinsic value of a company.
Of course, the model is subject to interpretation, as is any valuation model. The discounted cash flow models are open to second-guessing when it comes to how you treat both the discount rates and the growth rates, which are of uber importance for the model.
Try out the absolute PE model out and let me know what you think; I find it easier than using a relative valuation method, and by incorporating additional metrics, we encompass all aspects of the financial results of the company.
That is going to wrap up our discussion today.
As always, thank you for taking the time to read this post, and I hope you find something of value on your investing journey.
If I can be of any further assistance, please don’t hesitate to reach out.
Until next time, take care and be safe out there,
Dave
