The Return on Equity formula (ROE) is an important metric for judging the profitability of a company and how efficiently management is using the equity that shareholders have invested in the business.
However, having a high ROE does not necessarily make a company a good investment. As always with investing, it comes down to price.
Sadly, the return on equity formula as calculated from financial statement numbers has nothing to do with price.
The method I present in this blog post, which I call Investors’ Adjusted ROE, is my personal favorite approach to value investing with ratios. It shows that a good deal about valuation and long-term returns can be approximated by combining some readily available metrics.
Incorporating Investors’ Adjusted ROE into your valuation process will help ensure you never overpay for a stock. This article will go over the logic and math behind the formula as well as discussing its limitations. We will also use cyclical tire manufacture Michelin as a real-life example to show the strengths of the formula.
This is a guest contribution by Cameron Smith.
Guest bio: Cameron Smith is a CPA, CMA (Chartered Professional Accountant, Certified Management Accountant) from Toronto, Canada.
Cameron has an Honors Bachelor of Business Administration degree from Western University’s Ivey Business School where he had the opportunity to be taught value investing at the university’s Ben Graham Centre for Value Investing and to meet Warren Buffett in 2012.
On the side of his career in corporate finance, Cameron maintains his passion for value investing through being an active author and contributor on Seeking Alpha (author page: https://seekingalpha.com/author/cameron-smith#regular_articles).
Combining ROE with the P/B Ratio
We can make the profitability ratio, ROE, very meaningful to investors by combining it with a valuation metric in order to make it show the approximate earnings yield that an investor could expect to make on their own equity investment at the current market price.
Bit of a big sentence I know… but I will add some calculus for all those visual learners.
The return on equity formula, for a quick refresh and to start adding in some formulas to play around with, is calculated as follows below:
Return on Equity = Net Income / Average Shareholders’ Equity
= $20 million / $100 million
= 20%
Side Note: Net income represents a twelve-month period and can be taken straight from a company’s annual income statement or by adding together four quarters worth of figures. Average shareholders’ equity can be taken straight from the balance sheet as the average between shareholders’ equity at the end of the last reporting period (twelve months ago) and the current period. Shareholders’ equity consists of the original capital invested into the business by its founders, any subsequent capital raises, as well as any net income that has been retained in the business and not paid out as dividends or used to repurchase the company’s own shares.
Like I said earlier, the ROE formula has nothing to do with price. The shareholder’s equity used in the formula is a balance sheet item and has nothing to do with the market capitalization of the company.
Buying a Stock is not the Same as Contributing Equity to the Business
When one goes out and buys a company’s shares in the stock market, they are not contributing new equity to the business but are “trading” their cash for a previous investor’s equity share. The shares being bought have likely been traded thousands of times since the original investor contributed their money into the business for an equity stake. The price the new investor is paying for a share of equity is often wildly different from book value/shareholders’ equity.
At this point, studious investors who know their ratios might be getting a sense of where I am going and with what valuation metric I want to adjust the return on equity formula with…
That valuation metric would be price-to-book value (keep in mind that book value is just another fancy word for shareholders’ equity).
Price-to-Book Value = Company Market Capitalization / Book Value
or on a per share basis
Price-to-Book Value = Share Price / Book Value per share
= $80 / $20
= 4.0x
By combining the return on equity formula and price-to-book value, we can “adjust” ROE to reflect the actual return, in the form of an earnings yield, that an investor could expect to get on their equity investment at the current market price.
Investors’ Adjusted ROE = Return on Equity / Price-to-Book Value
= 20% / 4.0x
= 5%
As can be seen in the example, an investor who is buying at a price above book value will not necessarily receive the company’s internal 20.0% ROE but will instead receive an adjusted 5% ROE based on the 4.0x market price they are paying for the book value of the business.
Highly profitable companies with a strong ROE often trade above book value while lower profitable companies trade near and even sometimes below book value. This is a natural relationship in an efficient market but things can always stray away from the mean, and that’s where value investors come in.
As mentioned earlier, the output of the Investors’ Adjusted ROE ratio is an earnings yield. To further cement this relationship in a visual way, let’s take a detailed look at the adjusted return on equity formula.
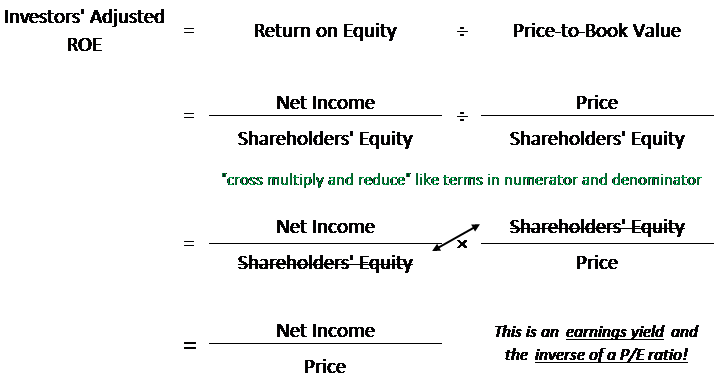
As can be seen, when we lay out the detailed formula for return on equity being divided into price-to-book value, we can use a little math to cross-multiply and cancel out like terms in the numerator and denominator. After reducing the formula, we are left with net income over price which is an earnings yield and the inverse of a P/E ratio.
Cyclically Adjusted Return on Equity Formula
Once the relationship between the return on equity formula and the price-to-book value is established, we can start to do some more interesting analysis with the combined ratio.
One such analysis, is adjusting this new earnings yield for cyclicality in the business. This can be done by making the ROE used in the Investors’ Adjusted ROE equation an average of the past 10 years in order to represent the business’s average ROE over a full business cycle.
It follows the same base logic of the CAPE Shiller ratio but since it is based off of ratios and not currency/dollars, it is not necessary to adjust the annual numbers for inflation (except for adding growth, which will be discussed later).
Let’s look at the well-known tire manufacturer Michelin as an example.
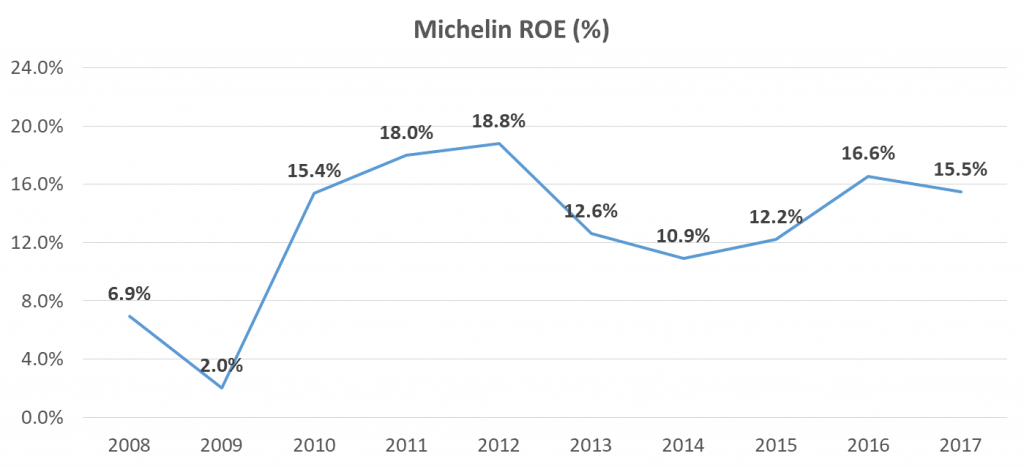
Source data from Morningstar
As can be seen, Michelin is a prime example of a cyclical business with ROE ranging all the way from 2.0% during 2009 in the depths of the financial crisis to a high of 18.8% in 2012.
Long-term investors should be more inclined to focus on the 12.9% average ROE generated for Michelin’s owners during the 2008-2017 period however, as this would support the methodology to invest in a contrarian and opportunistic style, both at market troughs and peaks.
Using this 12.9% average ROE rate in the Investors’ Adjusted ROE formula and Michelin’s price-to-book value of 1.6x at the time of this analysis, one would come out with a decent 8.1% return that long-term investors might expect to earn at their current purchase price.
This is notably different from the 9.7% which investors would calculate if they only used 2017’s 15.5% return on equity and might be enough to change an investment decision for a methodical long-term investor.
Investors’ Adjusted ROE = Return on Equity / Price-to-Book Value
= 12.9% / 1.6x
= 8.1%
Side Note: The ROE that I have used in the average is simply based on company financial statements as reported under GAAP or IFRS accounting standards. While some might argue that one-time and extraordinary items should be adjusted out of the average ROE, the argument for leaving them in is that truly one-time items will see their significance diminished in the 10 years’ worth of data and reoccurring items (such as restructuring, product recalls, etc.) probably represent natural costs in the industry over a business cycle and should be included.
Adding Growth to Investors’ Adjusted ROE
Just like the earnings yield calculated from the P/E ratio, the earnings yield that is represented by the Investors’ Adjusted ROE is a “real” yield meaning that it does not include factors such as growth or inflation (think real GDP vs. nominal GDP).
As such, one can add a growth rate on top of the Investors’ Adjusted Return on Equity formula.
There are many ways to calculate growth but for the purposes of the Investors’ Adjusted ROE, I use the Sustainable Growth Rate (SGR) methodology because of its simplicity and roots in ROE, which our calculations have been based off of so far.
The SGR is calculated as shown below by taking the portion of net income that is retained in the business (not paid out in dividends) and thus added into shareholders’ equity through retained earnings.
These retained earnings can then be invested alongside the existing equity to earn a further return for the business.
Sustainable Growth Rate (SGR) = (100% – Dividend Payout Ratio) x ROE
Side Note: The sustainable growth rate is “sustainable” because it implies that the business is growing with internally generated and retained net income. It is considered “sustainable” because the business is not relying on the capital markets to raise new equity or debt financing. The formula assumes a constant capital structure and dividend payout ratio.
To continue on with our Michelin example, let’s see how an Investors’ Adjusted ROE changes once we add on the potential effects of growth.
Once again, I will use the 10-year averages of the company’s ROE and dividend policy in order to capture the effects of the business cycle.
These averages are 12.9% for ROE once again and 45.4% for the dividend payout policy. Putting these averages into the SGR formula, we get a growth rate of 7.0%.
Michelin’s SGR = (100% – Avg. Dividend Payout Ratio) x ROE
= (100% – 45.4%) x 12.9%
= 7.0%
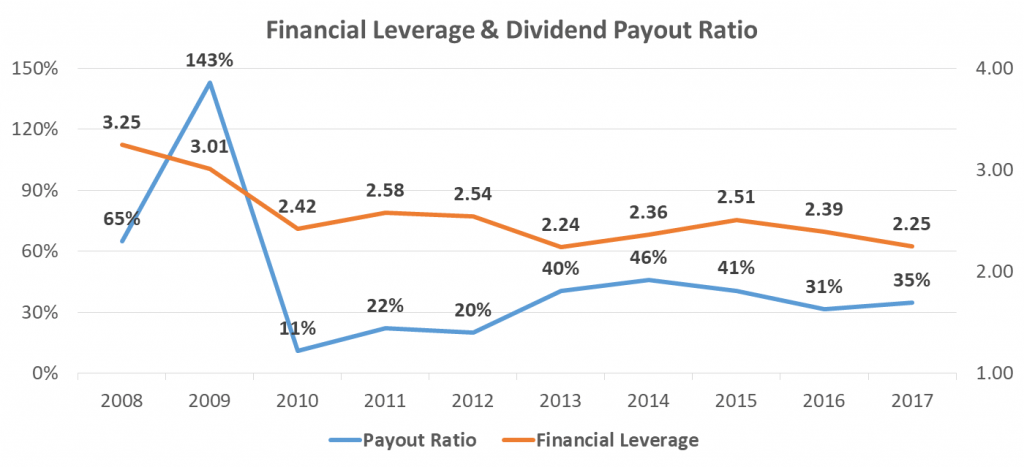
Source data from Morningstar
This calculated growth rate of 7.0% is a rather high growth rate, and while it might be achievable for a company with a sustainable competitive advantage and great brand name such as Michelin, it should be taken with a grain of salt and healthy scepticism as all formulas should be.
As mentioned previously, the SGR formula assumes a constant capital structure and dividend payout ratio.
If we analyze the 10 years of data that went into the formula, we can see that while the company is definitely profitable and with a well-covered dividend most of the years, long-term value investors should be prepared to hold this name through a recession while the company’s dividend is not covered by income.
Side Note: As a cautious investor, I generally do not put a growth rate above 3% on top of any earnings yield. It is very hard for a company (even those with a strong brand) to grow above the rate of GDP for a decade, let alone grow to perpetuity. The max of 3% that I add in efforts of conservatism represents the combined long–term rate of inflation and earnings growth above inflation.
Putting it All Together (ROE, P/B, and Growth)
By only using ratios and not even mentioning any dollar figures, I am able to get a general idea of a company’s long-term return potential through the Inventors’ Adjusted Return on Equity ratio.
For those readers that have not yet put the 8.1% cyclically adjusted Investors’ ROE figure and 7.0% growth rate together in their head, they add up to a combined 15.1% yield.
With a more conservative 3% growth rate, returns might still reach an 11.1% rate, if history repeats itself, which is a very decent return over the long-term.
It is critical for an investor to make a decision based on the current book value per share and market capitalization of the company’s equity. Only then can an investor judge what the expected return on their equity investment could be.
Remember that just because a business has a high ROE, it does not necessarily make for a good investment. And, on the flip side, mediocre businesses can make for decent investments at the right price.
LIMITATIONS: As with any calculation and valuation, investors need to be aware of some of items that are going into the final number. Some items I have noticed, but not a complete list by any means and growing, is shown below:
- Return on equity can be distorted by things such as changes to financial leverage, aggressive share buybacks, asset write-downs, and opportunistic asset purchases.
- Share repurchases could also be included as part of the dividend payout ratio for the SGR calculation if they are a large part of the capital structure and/or seem to be taking away from growth capital investment.
- Net income should be a good approximation of cash flow, but aggressive management are a natural occurrence in society and accounting lapses are always popping up in the news. True net income, ROE and returns to shareholders are based off of cash flows. If net income is not a good indication of cash flows for the business in question, a more robust analysis should be carried out.
