The change in how companies invest their capital has grown exponentially, and accounting rules have not kept up. Intangible assets comprise a larger portion of a company’s equity and assets than twenty years ago.
While at the same the amount of physical assets on companies’ balance sheets has dropped. That shift has occurred during the shift to a more focused knowledge-based economy.
Many of the most influential companies globally, Amazon, Apple, Meta, and Google, are dominated by knowledge assets instead of physical assets. Think of Google’s search engine; the driver of that product’s success is the R&D, engineers, and marketing. But finding any of that on the balance sheet is difficult; connected to either intangible assets or goodwill, but nothing physical.
Learning more about how intangibles function and how to value them will help us better understand the value of companies today. The basic way that businesses grow is by earning a return on investments. We measure those returns on the profits created by increasing revenues and expanding margins.
In today’s post, we will learn:
- What Are Intangible Assets?
- Understanding Intangible Assets and Their Impact
- Example of Analyzing Intangible Assets: Etsy
What Are Intangible Assets
There are two types of assets, intangible and tangible. We can touch or feel tangible assets, such as factories, trucks, and machines. Intangible assets lack a physical substance, including Coke’s secret recipe, the formula for a life-saving drug, or proprietary software from Apple.
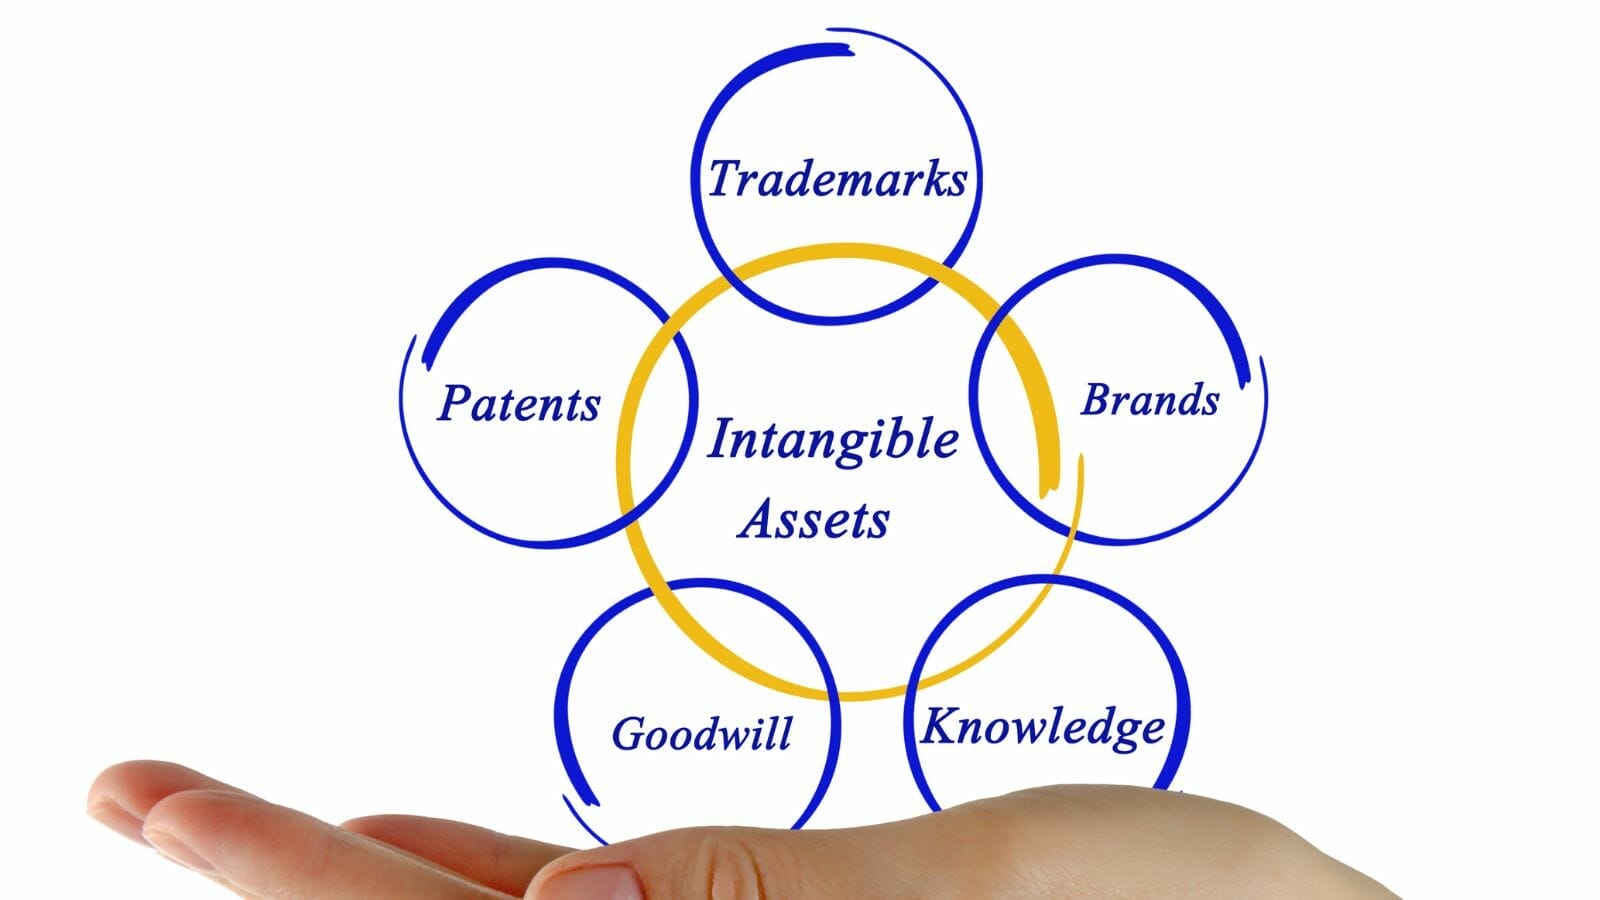
Further, accounting defines intangibles as:
- Goodwill
- Brand recognition
- Intellectual property
- Patents
- Trademarks
- Copyrights
Intangibles comprise the second-largest classifications of many company assets behind PP&E (property, plant, and equipment). According to accounting standards, intangibles are assets that companies expect to generate returns in the future, in many cases, beyond one year.
We can separate these intangible assets into two classes:
- Identifiable
- Non-identifiable
Identifiable assets – are intangible assets that a company can sell, such as patents, copywrites, trademarks, trade names, or intellectual property. Items such as computer software and other assets related to computers beyond software fall into this category.
Unidentifiable intangible assets – are those that the company can’t sell, the most obvious intangible asset being goodwill. Most companies expense internally created goodwill, but external goodwill is considered an asset. Please think of the goodwill generated when companies acquire another company; that acquisition makes its way to the balance sheet by way of goodwill; it occurs when there is a discrepancy in the price paid for the company and the fair value of the acquisition. The difference ends up on the balance sheet as goodwill. Unlike most other intangible assets, there is no amortization; instead, it is tested for impairment annually.
Another unidentifiable intangible asset is branding or reputation. Think of Coke selling its brand, or Nike, not likely, but if it did occur, it would not be easy to separate the logo from Nike’s reputation. Hard to put a price on that brand or reputation.
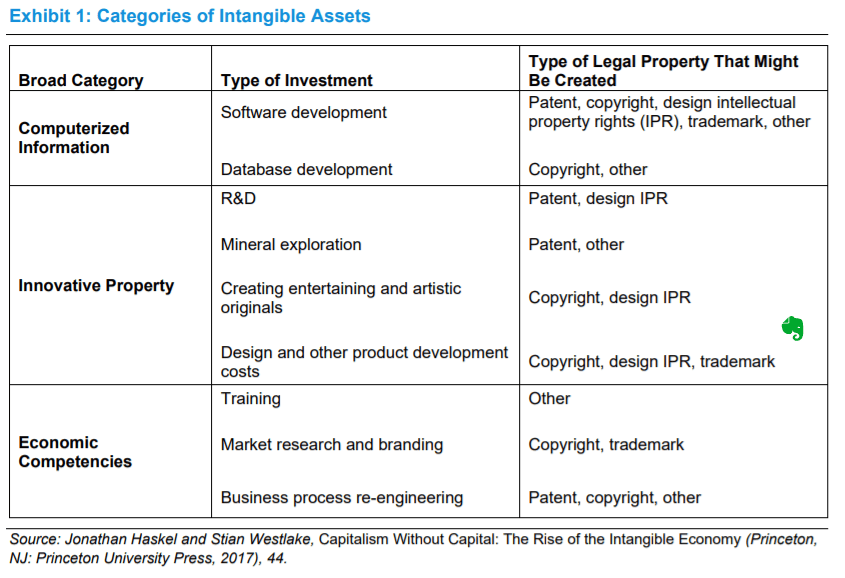
Below is a chart of intangible assets so you have a list to work from through this post. Check out the book Capitalism without Capital, a great resource on intangibles and investing.
Understanding Intangible Assets and Their Impact
With the rise of intangibles in the economy and their accounting treatment, investors need to think outside the normal conventions regarding accounting. The accounting standards on the treatment of intangibles have not kept pace with how companies finance their growth.
A large contingent of companies in the global economy now powers themselves on intangibles. Go back to our list and include companies like Tencent, Alibaba, and Mercadolibre, to name a few. Much of their growth is powered by new technologies that interact with customers and businesses more seamlessly and power the growth.
Many of the top thinkers in finance, Aswath Damodaran, Michael Mauboussin, Dan Callahan, and Lev Baruch, have embraced these ideas and incorporated them into their teachings.
To step back for a moment, in 1974, the FASB (financial accounting standards board) published a statement regarding the treatment of research and development (R&D) that required it to be treated as an expense because the economic benefit was too uncertain.
That may have been true back in 1974, but in today’s world, much of the realization of the economic benefits of R&D isn’t until further down the road. For example, expensing an item declares that the benefit the company realizes will come in the fiscal year. But, many of the creations created from R&D aren’t realized for many years. Please consider how long it took to create Google search, Apple iphone, or Microsoft Windows. Certainly longer than a year, but the companies received no economic benefit from accounting standards.
How the companies invest has changed much over the years, but accounting for those investments hasn’t altered much, except for intangibles acquired through mergers and acquisitions (M & M&A).
We need to look at the income statement to account for these investment changes and adjust them to align with how companies grow. We are looking at how we can measure the intangibles to value them.
The trick is to reassign the expenses differently or deconstruct the income statement to align closer to the economic reality of the business you are analyzing.
For example, from the top of the income statement, we have revenues followed by costs of goods sold, representing the direct costs for the goods or services that Etsy sells. We will find the intangibles in the operating expenses section of the income statement.
This section will find the SG&A expenses containing many intangible assets. Within the SG&A are selling, general, and administration costs not associated with the direct creation of goods and services.
We will cover the SG&A section of the income statement first, then move on to the ideas around R&D and marketing.
The challenge is determining how much of a company’s SG&A is an investment and its cost?
The leaders on this idea come from the paper “Should Intangible Investments Be Reported Separately or Commingled with Operating Expenses? New Evidence” by Luminita Enache and Anup Srivastava.
Their approach starts with total SG&A, subtracts R&D and marketing, already considered intangible assets, which will cover in a moment. After subtracting the other intangibles, they develop “Main SG&A.” They then determine what part of the Main SG&A is necessary for maintaining the business (Maintenace Main SG&A) and separate the rest as “Investment Main SG&A.”
The Maintenance Main SG&A matches sales, office costs, warehouse rents, sales commissions, and other related costs. The Investment Main SG&A deals with employee training, customer acquisition costs (CAC), and software development.
Before we dive in and rework the income statement a bit, free cash flow is unaffected by these reworkings. All these adjustments aim to uncover how a company invests to grow, but the free cash flows are unaffected.
We need to address two crucial steps before reworking the operating expenses. The first is the percentage of each line item we assign to the operating expenses, including R&D, marketing, and general and administration. The fractions assigned by Charles Hulten, an economics professor at the University of Maryland and one of the leading researchers in intangible asset accounting, are:
- 100% Research and Development (R&D)
- 70% Sales and Marketing (S&M)
- 20% General and Administration (G&A)
The next step is to determine the length of amortization of each line item. The idea is to match the amortization period with the asset’s life. Unfortunately, there are no hard and fast rules for this amortization, but we will follow Maoboussin’s suggestions:
- R&D = 6 years
- S&M = 2 years
- G&A = 2 years
We mentioned earlier that these deconstructions don’t affect free cash flow, but let’s take a moment to define that idea.
Free Cash Flow = NOPAT (net operating profit after taxes) – Investment in growth (I)
NOPAT equals EBIT (earnings before income taxes) or operating income. Investments in growth related to changes in working capital, capital expenditures net of depreciation, and acquisitions.
The free cash flows are the monies available to shareholders, and it is the number we use to discount to determine the value of our company. It is also known as the unlevered free cash flow or the free cash flow to the firm model (FCFF).
NOPAT is more involved, particularly regarding taxes, but I thought we would simplify it; otherwise, we could spend pages on tax treatments.
Example of Analyzing Intangible Assets: Etsy
To put this into practice, I thought we could deconstruct Etsy’s income statement to analyze its intangible assets. The information for our example is taken directly from the fiscal 10-k, dated February 26, 2021.
First, we will look at the free cash flow for Etsy:

Let’s focus on Etsy’s 2020 results for a moment; we see that the company has $289 million in free cash flow or $405 million in NOPAT with additional invested capital of $124 million.
Next, look at Etsy’s intangible investments in the income statement. We take the total of each line item listed in the income statement; then, we will multiply it by the allocation suggested above to determine a total intangible investment.

By utilizing the ratios above, we can see that Etsy invested $562.5 million in intangibles in the business in 2020, compared to $296.9 million in 2019.
Now, we can amortize the above intangibles by the preceding recommendations using a straight-line amortization using the calculated intangibles.

And following the same process, we arrived at amortized intangibles of $107.8 million for 2019.
Now that we have the intangible investment and amortized expenses, we can make two adjustments to the income statement and one to the balance sheet. First, we add the intangible assets, less the amortized expense, to the NOPAT from our free cash flow calculations. The net addition will increase NOPAT as long as the intangible assets are growing. Next, we add the same amounts to the investments, which grows the investments. And finally, we need to capitalize the intangible investment on the balance sheet and amortize that number at six years, matching the longest amortization of intangibles.
Next, look at the adjusted NOPAT or FCF from our amortization of the intangible assets.

Okay, notice that both free cash flow calculations remain the same, $383 million for 2019 and $289 million for 2020. Notice that the adjusted NOPAT is over 84% higher than the NOPAT in 2020, resulting from adjusting the intangible investments that Etsy made through its income statement. That increases Etsy’s operating margins from 26.8% to 42%. For Etsy, the NOPAT is a fair proxy for the company’s net income, which shows the impact of adjusting the intangible investments.
Okay, now that we have a handle on the operating income adjustments or NOPAT adjustments, let’s look at the other side of the equation, the adjustments to the balance sheet. To do this, we will look at our invested capital to calculate ROIC (return on invested capital). To do this, we will amortize the above intangibles and amortize those over six years and then add those adjustments to the invested capital for Etsy.
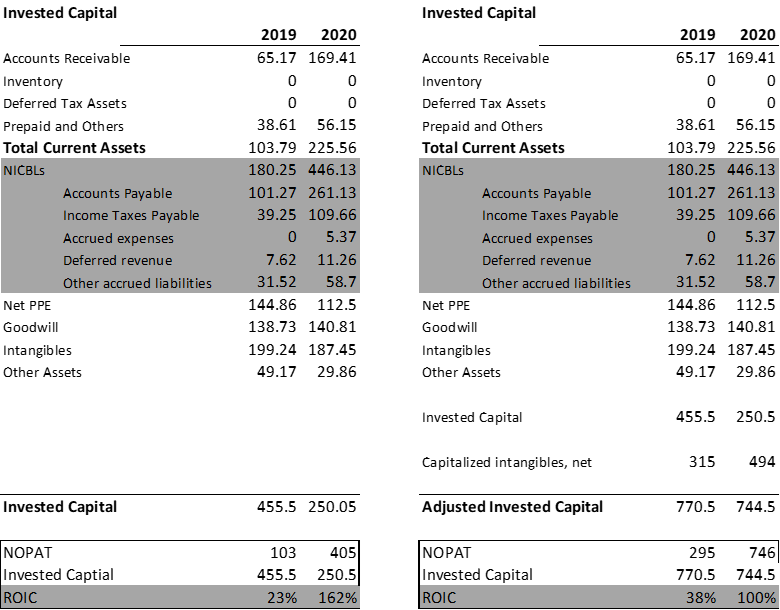
After all the adjustments, we can see that Etsy’s ROIC declined due to the increases in both adjustments to the NOPAT and invested capital, plus the amortization of those intangible assets from the balance sheet.
The lower ROIC is offset by the increases in operating margins, which increases the firm’s free cash flows and elevates the company’s valuations.
Follow the steps to determine the dollar amount of intangible assets from the income statement, adjust NOPAT and invested capital accordingly, and then capitalize those investments to adjust the balance sheet. All of those changes will highlight the impact of intangibles on the company’s growth by increasing operating margins while lowering ROIC.
Investor Takeaway
There are several takeaways from this exercise of analyzing intangible assets. First, how we treat the accounting of investments for businesses has not adapted to the current economic reality, and we need to adjust to those changes.
Using the method described above, we can get a better sense of the investments that drive the growth of companies. Much of the company’s growth, such as Twilio, doesn’t come from traditional PP&E but intangibles such as R&D, employee training, and marketing.
These traditional expenses are now intangible assets for us to recalibrate on the income statement to give a truer sense of the economics of Twilio, for example.
Consider that R&D for many companies, such as Meta leads to new and better innovations, which drive revenues for years if not decades. For example, Meta is spending billions on virtual reality devices to dominate this growing technology. Those investments in VR likely won’t pay dividends for Meta for years, but those costs must be expensed by accounting rules even though Meta won’t see impacts for years.
That is why considering the adjustments we discussed today is a better way to find the company’s economic value and determine what Wall Street expects.
For more reading on this fascinating subject, consider these resources:
Michael Mauboussin and Dan Callahan: One Job – Expectations and the Role of Intangible Investments
Michael Mauboussin and Dan Callahan: The Impact of Intangibles on Base Rates
The Rise of Intangible Assets – Harriet Clarfelt
Intangibles: Management, Measurement, and Reporting – Lev Baruch
Decoding Microsoft: Intangible Capital as a Source of Company Growth – Charles Hulten
Expectations Investing – Michael Mauboussin
The above resources contributed to my understanding of this important topic and helped me get my head around the concepts. All of the readings above should keep you busy for a while.
Understanding intangibles and learning how to treat them in financials is critical to determining the value of your investments.
And with that, we will wrap up our discussion on analyzing intangible assets.
As always, thank you for taking the time to read today’s post, and I hope it helps you on your investing journey. If I can further assist, please don’t hesitate to reach out.
Until next time, take care and be safe out there,
Dave
