Evaluating management and how much they receive in pay go hand in hand. As investors, trying to assess a company’s management remains a challenge. We can see the importance of the CEO and top-level management from companies like Microsoft and Apple.
But the topic remains controversial, and as investors, we need to find the information and evaluate their pay. Otherwise, we will continue to see controversy.
“Compensation Soars in Wake of Pandemic” and other headlines like this topped the news in the past year. We also see that the gap between large companies pays vs. smaller companies continue to widen.
Many in the press, social media, and the general public feel CEOs and their teams make too much. And in comparison to the people working under them, it can seem extreme. So what is fair, and what is best for management and shareholders?
We can look at the different documents and compare them to their peers, but fair in one’s eyes may not be fair to another. These are “soft skills” we will examine today.
Well, let’s dig in and find out.
In today’s post, we will learn:
- How Do You Assess Executive Compensation?
- What Are the Five Forms of Executive Compensation?
- How to Find Executive Compensation
- Examples of Executive Compensation
- What is Good or Fair Executive Compensation?
Okay, let’s dive in and learn more about evaluating executive compensation.
How Do You Assess Executive Compensation?
The easiest and most direct way to assess management pay is to go to the direct source. We refer to those documents as the annual proxy statement or proxy. We can also call it the DEF14A statements.

All of the above terms remain interchangeable. But they all reference the same document. These documents allow us to access all the pertinent management pay information. It’s just a matter of reading and interpreting them.
All publicly listed companies are required to file these proxies. They must disclose information about the pay and type of compensation for the C-suite managers; this includes the CEO, CFO, COO, and others.
In the document, they must also tell us how they receive their pay. For example, is it based on revenue growth, earnings per share, or stock performance?
These examples are just a few of the possibilities and each company has a different methodology for assigning a salary and any bonuses or awards.
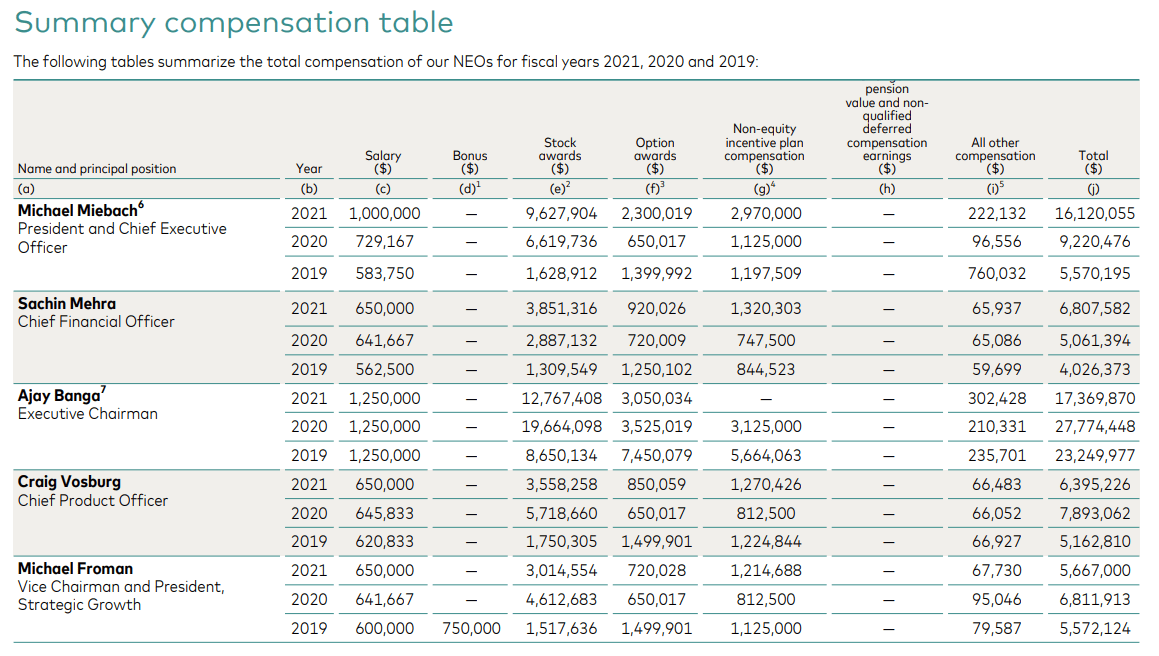
The SEC requires each company to supply a Summary Compensation Table to outline compensation. The Summary Compensation Table outlines in one place the compensation along with the means to earn.
Here is a list of items the Table includes:
- Information regarding stock grants
- Stock options requirements
- Long-term incentive plans
- Pension plans
- Employment contracts
- Any other related arrangements, for example, car stipend
The proxy also features a CD&A section which helps provide more compensation information. Think of it like the MD&A from the annual report. We will find more narrative behind the executive pay in this section.
So why all the focus on executive pay?
As Charlie Munger says, “Show me the incentive, and I will show you the result.”
Focusing on executive pay helps us determine a company and management’s incentives. It also helps us see if those incentives align with shareholders, which is important.
Combining the fact that the public believes management gets paid too much and the challenges of assessing the pay, we have a gap that drives uncertainty, and the markets hate not knowing.
Consider this little tidbit: according to a 2015 study, 38% of institutional investors believe proxies are easy to read. Combine that with the idea that institutional investors are professionals. How can the average investor stand a chance?
We can use the proxy to help us, but understanding is difficult. And many times, they make it difficult on purpose.
But we can do it.
What Are the Five Forms of Executive Compensation?
The typical package an executive receives has five different components. These components are:
- Base pay
- Health and Retirement benefits
- Short-term incentives
- Long-term incentives
- Fringe benefits
Let’s unpack each of these a little.

Base Pay
Base pay equals what you think it does, the executive’s salary. For public companies, the base pay tends to match those in the same industry.
For example, American Express will pay their executives a relative base pay compared to Visa and Mastercard.
In some cases, the base pay is higher because the company offers no benefits or stock options. And to entice quality people, they might up their base pay to encourage better candidates.
Health and Retirement Benefits
The companies will pay executives health and retirement benefits similar to regular employees. Each executive is part of the company’s health and retirement benefits.
In some cases, the company will continue to pay an executive’s health benefits after they retire.
Short-term Incentives
Companies may use short-term goals such as bonuses and annual incentives to encourage them to achieve goals. Most times, the short-term incentives revolve around cash payments. But sometimes, they can tie them to short-term goals but pay them out in the future.
For example, Mercado Libre, the South American e-commerce company, pays their executives this way. They have short-term goals to meet, which they pay in cash. But they don’t vest the cash until five years later. They do this to encourage management to stick around.
Long-term Incentives
The long-term incentives revolve around stock options or equity. This remains the most controversial part of company compensation.
One of the conditions of these incentives is for the employee to remain with the company. If the employee leaves, they forfeit their incentives.
The long-term incentives mature in the future and payout over several years.
The stock options, where big money paid to executives comes into play, have three different types.
- Non-qualified stock options – These options allow the executive to buy company stock at a set price. Many times they vest in increments and can span many years. These are attractive options for high-growth companies.
- Incentive stock options – These options allow the employee to buy a stock at a set price. They must exercise them within a calendar year and have a $100k annual limit.
- Restricted stock and restricted stock units – These options allow executives to buy the stock once meeting certain restrictions. Most companies tie these options to performance goals, longevity, or other company goals. They provide the opportunity for the executive to have shares in the company, but they vest over time once they meet certain criteria. They also have the option of receiving company stock or cash value.
How to Find Executive Compensation
The main document which can help us find executive compensation is the proxy. The proxy, or DEF14A, as the official name goes, gives us all the executive compensation.

Within the proxy, by SEC guidelines, we have a section called the Summary Compensation Table.
The table gives us an outline of the top executives and their annual compensation. We can see their last three years of compensation, covering topics such as:
- Base salary
- Bonus
- Stock awards
- Option awards
- Non-equity incentive plan
- Others
Most companies will have notes defining any clarifications they need to make. For example, some companies’ stock award amounts reflect the grant value at the time. Indicating the amounts might change when these awards vest or payout.
The bottom line: the Summary Compensation Table is the best single place in the proxy to find the executive compensation.
We can peel away different layers on the individual items to see how they arrive at the totals.
For example, we dig into the base salary and find the other companies Salesforce uses as references. We can also find out how they award bonuses related to goals.
Now Salesforce does something interesting; they list the CEOs’ total pay relative to the median employee. Marc Benioff, CEO, received $25.7 million in pay in 2022. His salary was $1.5 million, while the median employee receives $135,930.
The bottom line: the proxy contains tons of useful information investors can use to asses management. Remember, incentives align with shareholders and continue as the goal.
The proxy contains information about voting, the board of directors, ESG, and other important items. We can use it to help us find information related to executive pay, which we can use to determine how well the company’s pay aligns with shareholder value.
Examples of Executive Compensation
The best way I have learned to assess executive compensation is to compare several companies in the same industry. For our purposes here today, we will look at three companies in the payment sector.
Here is a little cheat sheet to use when we assess executive compensation to summarize this section.
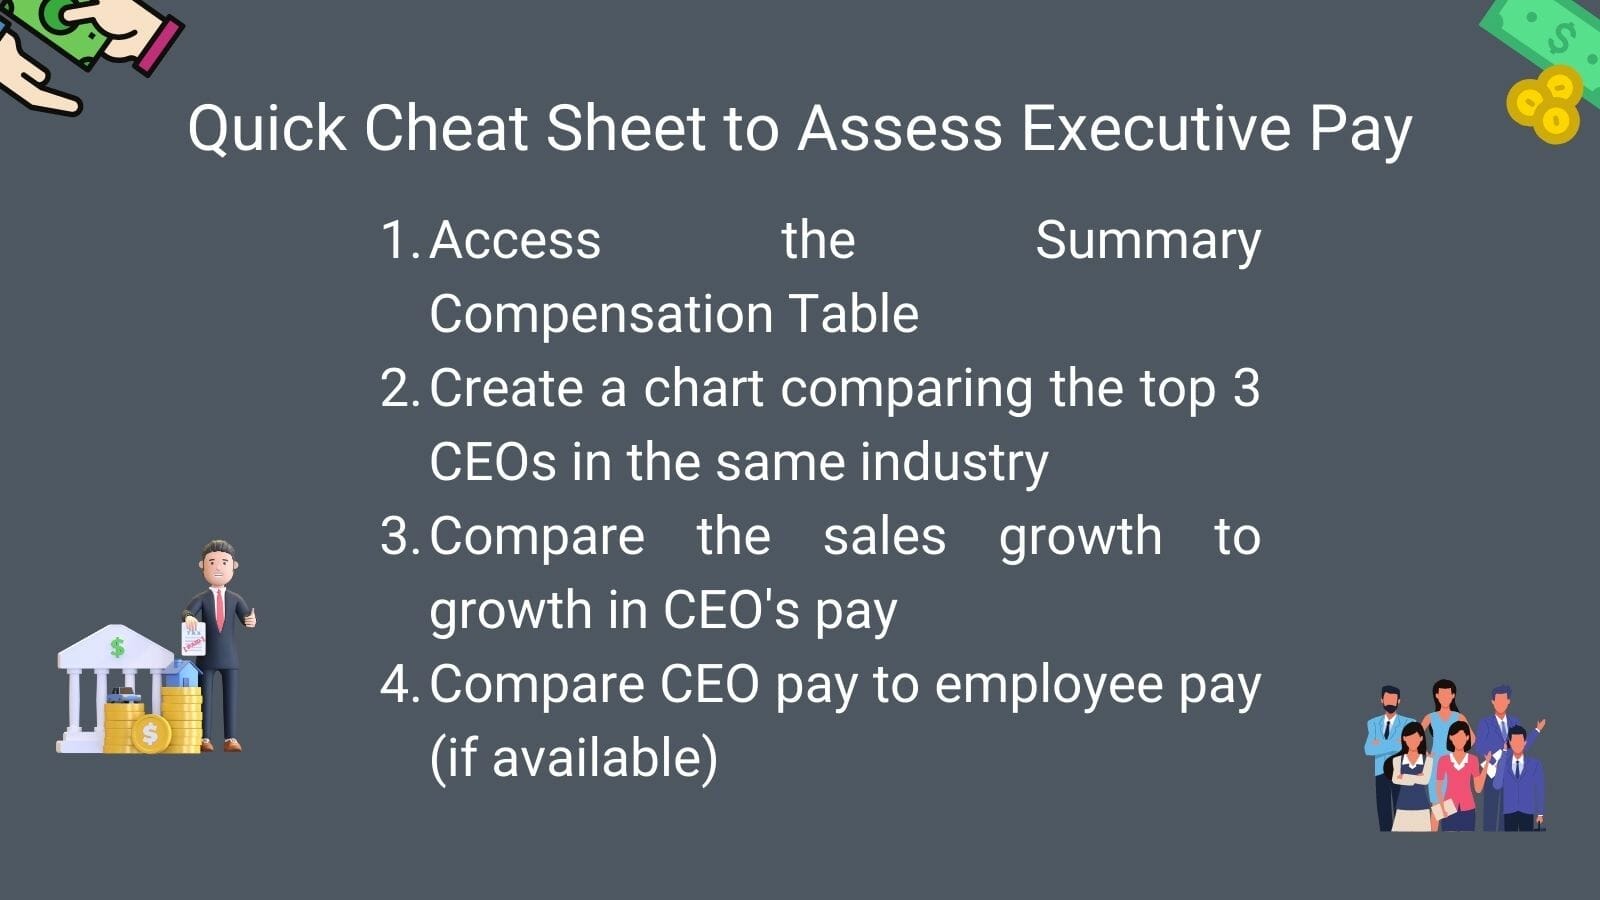
We will use the companies’ Summary Compensation Tables to create a graph outlining the CEOs’ pay for Visa, Mastercard, and Paypal. This exercise examines these three similar companies and how they pay their CEOs.
First up, Visa.

Next up, Mastercard.
And finally, PayPal.

Let’s assemble our chart to compare the CEO’s pay. All numbers will be in millions unless otherwise noted.
|
Name |
Salary |
Stock Awards |
Option Awards |
Non-equity incentive plan |
Extras |
Total |
|
Alfred Kelly (Visa) |
1.5 |
14.7 |
5.3 |
6.2 |
239k |
28.1 |
|
Michael Miebach (Mastercard) |
1.0 |
9.6 |
2.3 |
2.97 |
222k |
16.1 |
|
Dan Schulman (PayPal) |
1.1 |
29.9 |
0 |
625k |
402k |
32.0 |
What can we take away from the above chart?
First, the salaries look equal across the board, along with extras such as retirement benefits, health care, and other perks. But when we get into stock awards and non-equity incentives, we see each company structuring their executive’s pay differently.
For example, PayPal’s CEO receives most of his pay in stock awards, which would prompt me to investigate how he earns those awards immediately.
Secondly, Mastercard and Visa spread the awards and incentives across the different asset classes, which would give me a reason to dig into those aspects of pay.
At first blush, it surprises me that Dan Schulman, PayPal’s CEO, receives the highest overall pay and stock awards, especially if we look at the performance over the last ten years; we can see Visa and Mastercard producing higher revenues and bigger revenue growth.
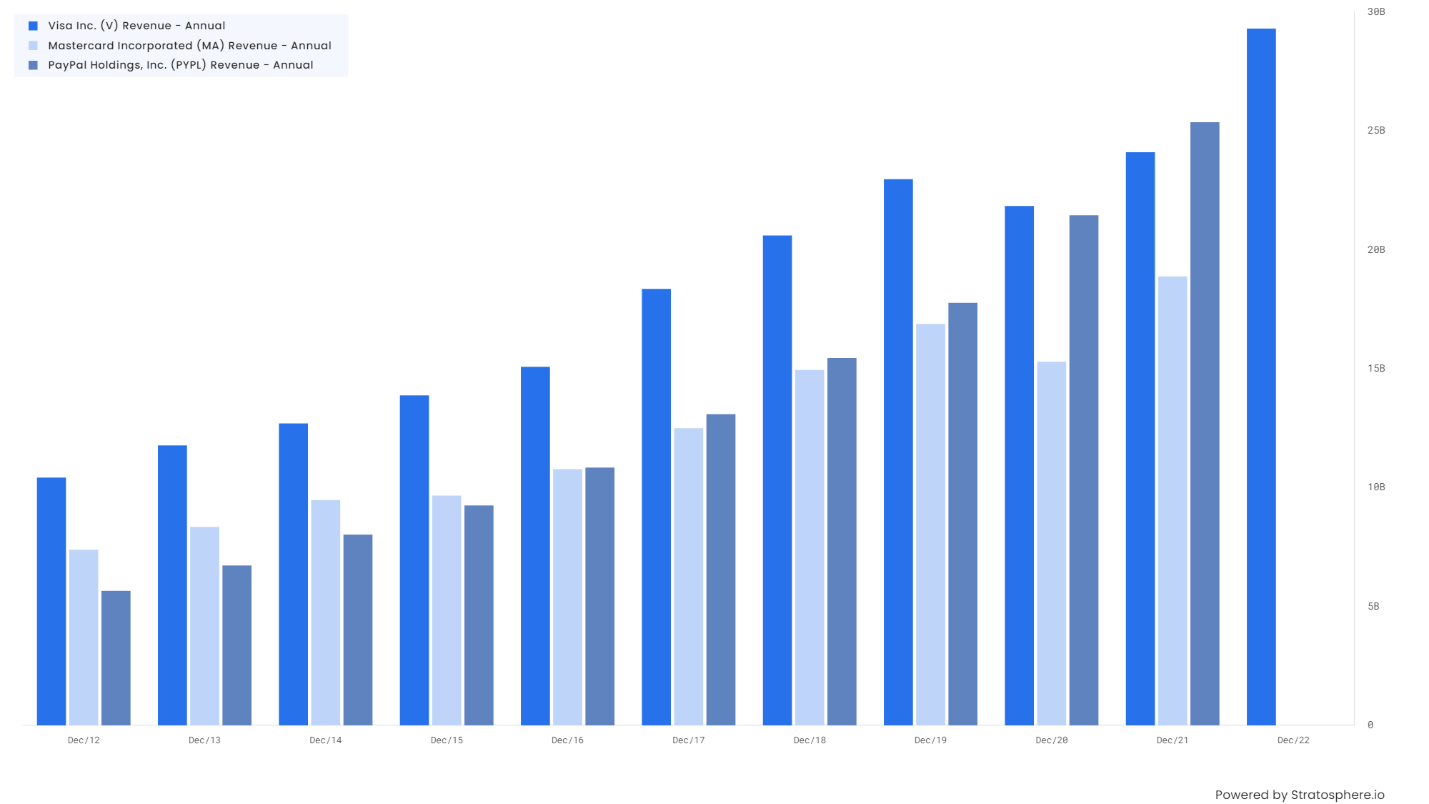
The chart above shows how each company has done over the last ten years, and we can see both Visa and Mastercard growing consistently bigger and faster than PayPal.
That might indicate PayPal is overpaying its CEO, but before coming to that conclusion, we might want to dig into the incentives first.
Another trick to look into I learned from friends at StockOpine is comparing the growth of the CEO’s salary to the growth of revenue year over year.
For example, we can see the following:
|
Pay up or down |
Revenue Growth % | |
|
Visa |
Up |
21.59% |
|
Mastercard |
Up |
23.42% |
|
PayPal |
Up |
18.62% |
Again, it looks like PayPal is overpaying, but we must remember that it was one of the pandemic wonders, with big revenue growth for several years, giving it a tough comparable. In comparison, Visa and Mastercard struggled during the pandemic and have rebounded quite well.
Visa offers a great example of the CEO pay ratio, which we can see from the below screen grab. Notice Visa’s ratio equals 184 to 1.
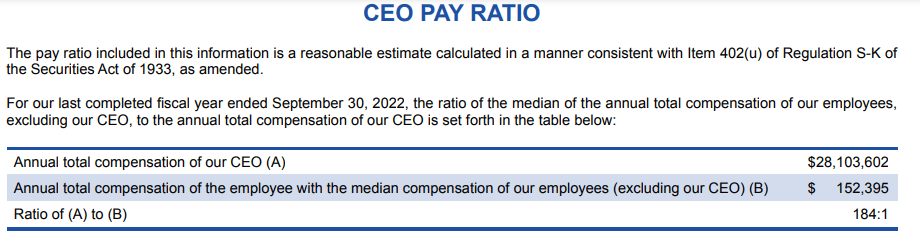
Mastercard lists their CEO pay ratio as 126 to 1, and PayPal’s equals 382 to 1. Wowza!!
This is a newer requirement for companies to disclose and gives us some insight into the pay scale for companies. We can use this to help us determine incentives and determine what we like and don’t like.
What is Good or Fair Executive Compensation?
According to Harvard Business Review, global CEO compensation ranges from $1.1 million to $16.7 million, with the Americas receiving the highest average compensation.
Of the pay breakdown, in the Americas, CEOs receive the pay via:
- Base salary at 9%
- Annual bonus at 16%
- Long-term incentives at 75%
This tells us that CEOs receive most of their pay in either stock awards or cash incentives, with the majority of it in stock awards.
Most companies use a formula to determine the pay scale for their incentives. Again, HRB tells us, “83% of the 250 largest S&P 500 firms use a formulaic plan or one that includes predefined metrics and weightings.” According to their study, most companies utilize multiple metrics with at least two. The most commonly used metrics are revenue and profits or earnings; no shock there.
Again, none of this should be a big shock.
Peter Drucker, management guru, believes the proper ratio between executive pay and employee pay should return to the range of 1965, which equals 20-1. It peaked at 376x in 2000 and has since fallen. But according to Forbes, CEO compensation has risen from 807% between 1978 to 2016, which is faster than the stock market, inflation, or employee pay.
Okay, so how do we determine what is good or bad?
Unfortunately, we have no exact recipe to answer the question; instead, it will come down to experience and some investigation.
Let’s look at a few examples to give us some reference.
First, Warren Buffett and Charlie Munger of Berkshire Hathaway offer a great example of prudent executive pay.
For example, Warren and Charlie both pay themselves $100,000 yearly. Yes, that’s right, that’s all they take. Warren also receives extras totaling around $237,000, which he uses for security.
The VAST majority of their wealth comes from the ownership of Berkshire Hathaway.
Another tidbit, they don’t offer any equity to their employees, including other management. They pay larger cash bonuses to Ajit Jain and Greg Abel, but zero equity. Berkshire’s CEO pay ratio equals 5.55 to 1.
Look at Mark Leonard of Constellation Software, the software serial acquirer from Canada.
Mark has set up his incentive structure based on the company’s performance. He pays any incentives in cash based on revenue performance and ROIC performance. He also requires executives to invest at least 75% of the bonus into the company’s common shares. They must hold those shares for at least four years.
Mark has also chosen to forgo his salary and bonus over the last three years. Plus, when he flies anywhere, he goes coach, so he doesn’t cost the shareholders any additional money.
I would call those shareholder-friendly decisions.
Now, here is a list from Kiplinger listing the highest CEO pay-to-employee ratios in the S&P 500, dated 2021:
- Aptiv – 5,294 to 1
- Western Digital – 4,934 to 1
- Gap – 3,113 to 1
- Paycom Software – 2,963 to 1
- Chipolte Mexican Grill – 2,898 to 1
- Ross Stores – 2,020 to 1
- Hilton Worldwide – 1,953 to 1
- Nike – 1,935 to 1
- L Brands – 1,873 to 1
- Coca-Cola – 1,621 to 1
The above chart gives us a head start on research but the news gives us an example of bad executive compensation.
Recently, Pat Gelsinger, who took over as CEO of Intel, received a compensation package of $178.59 million. The pay included $1 million in salary, $1.75 million in bonus, over $140 million in stock awards, and almost $30 million in option awards.
Now, this didn’t go over well with shareholders at all. Considering the company has struggled since he took over, the pay was OUTRAGEOUS, and shareholders revolted.
During the latest proxy vote, shareholders protested against the compensation packages for the top executives at Intel.
We can use all these examples as a starting point for our analysis. But remember, it is a process and can take some time. Also, keep in mind that companies might intentionally make things hard to find or difficult to decipher. If they do that, it might mean they have something to hide, which is a subtle signal that maybe they aren’t so shareholder-friendly.
Investor Takeaway
Part of our analysis of any business includes looking at the management and determining if they are shareholder-friendly. We can use the above examples and ideas to help us determine the answer to that question.
It is not easy, and measuring management remains one of the harder parts of investing, which is probably why it doesn’t get a lot of love because it is subjective and hard to pin down.
Don’t worry if you struggle to read through the proxies at first. Like a pizza, take it piece by piece, and focus on the important parts. Use this article as a guide to help you.
What is a Def14A Statement, and Why is it Important for Investors?
And with that, we will wrap up today’s discussion around assessing executive compensation.
Thank you for taking the time to read today’s post, and I hope you find something of value. If I can be of any further assistance, please don’t hesitate to reach out.
Until next time, take care and be safe out there,
Dave
Sources:
