Updated 9/15/2023
Capital allocation is job number one for any management team. The problem is that most CEOs lack this skill, intending to build long-term value for both shareholders and the company.
Warren Buffett talks about finding management teams he trusts and acting in the best interests of shareholders, and part of that is the capital allocation for each company.
What the CEO or management does with the capital created by the company’s operations goes a long way toward value creation and future growth. Allocating that capital to grow the company via new strategies, acquisitions, or good old-fashioned dividend increases are some of the best ways to create value for shareholders.
Assessing management’s skills in this area combines some soft skills and finance. We can determine how well management has done by analyzing past, present, and future performance.
In today’s post, we will learn:
- What Does Capital Allocation Mean?
- What Are the Three Ways to Measure Capital Allocation?
- Past Spending Patterns and Capital Allocation
- Measuring Capital Allocation with ROIC and ROIIC
- Incentives and Corporate Governance Impacts on Capital Allocation
Okay, let’s dive in and learn more about management’s capital allocation skills.
What Does Capital Allocation Mean?
Capital allocation is using a company’s financial resources to improve the company’s long-term financial stability and future value creation.

Capital allocation starts at the top, typically with the CEO, but includes management teams and board members. The CEO and management team work together to create a plan that moves the company in the direction they think is best for the company and, ideally, shareholders. However, that is not always the case.
Allocating capital is a difficult, complicated process involving a ton of skill; the company’s future success or failure often hinges on these decisions.
History is full of companies that allocated capital poorly or failed to see the signs until it was too late.
Recently, the former CEO of Intel, the semiconductor giant, was under a lot of fire because many investors felt that Intel had dropped the ball and failed to keep up with the latest developments in semiconductor chips and started to lose ground to competitors.
Many faulted the CEO for failing to allocate capital where it needed to go the most: R&D. As a result, the company started losing market share and is struggling to regain its former glory.
The CEO and management must weigh each option to grow value for their company, evaluate each potential effect on the company, and allocate the funds necessary to achieve their desired results. To do this, they have many options available:
- Mergers and Acquisitions (M&A)
- Research and Development (R&D)
- Capital Expenditures (Capex)
- Dividends
- Share buybacks
The above are some of the more popular options today, and with the movement towards a more service-oriented economy, there will be more investments in R&D as we advance.
As companies grow earnings and cash flows, there will be more and more opportunities to deploy that capital. Learning how well each CEO deploys that capital will be as important as the company’s financials.
What Are the Three Ways to Measure Capital Allocation?
There are three main ways to measure the capital allocation of a company:
- Past spending patterns
- Return on Invested Capital (ROIC) and Return on Incremental Invested Capital (ROIIC)
- Incentives and corporate governance

Every industry is different, and many may have capital allocation limitations.
For example, the banking industry has restraints based on their capital levels, and at different times, they can only allocate to repurchasing shares, dividends, or M&A activities. Wells Fargo is under a cap limit, meaning it cannot grow beyond $175 billion in assets, limiting their capital allocation to cash distributions via dividends and share buybacks.
Industries such as insurance also face stiff regulatory requirements and are under constant scrutiny from the government. Utilities also face regulatory restrictions on their capital allocation.
That is why it is important to understand each industry and its operations and capital allocation challenges.
To illustrate analyzing a company’s capital allocation and the management’s ability to use its capital, I think a great way to work through these ideas is to use an example. We could use Microsoft (MSFT) and its management team as our guinea pig, led by CEO Satya Nadella.
Past Spending Patterns and Capital Allocation
To assess management’s capital allocation skills, we need to study past performance. The best way is to break it into two parts:
- Investments in operations
- Capital expenditures
- R&D
- Working capital
- M&A
- Returning cash to shareholders
- Dividends
- Buybacks
- Debt repayment
The value of Microsoft is represented best by the present value of future cash flows. Free cash flow is best represented by NOPAT (net operating profit after taxes), which is the operating profit less taxes and less investments in future growth.
NOPAT derives from sales growth and the investments that drive that sale growth, and many of those investments stem from the company’s operating margin. In today’s tech-driven economy, many of those investments are on the balance sheet in the form of R&D and marketing. Other investments, such as working capital and acquisitions, drive sales and operating margins.
The best way to measure those value drivers is to measure them against every $1 change in sales, giving us a percentage we can track over a longer period. For example, if R&D grows by $10 in one year, and the change in sales is $100, we calculate the total R&D rate by dividing the change in R&D ($10) by change in sales ($100), which gives us 10% ($10/$100).
To assess Microsoft’s reinvestment, let’s work through each section based on their historical numbers. First, we will look at the R&D for Microsoft, which is incredibly important to a tech company.
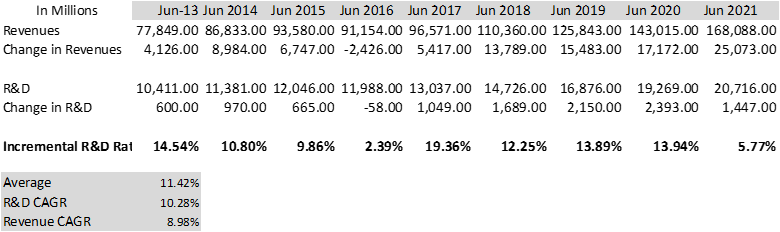
We can see the company is growing its R&D at a higher rate than its revenue, which might indicate it is investing at a higher rate or that the R&D investments aren’t paying off at a higher rate or aren’t as efficient.
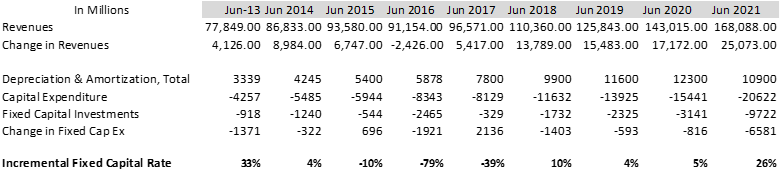
Let’s combine the same ideas with the next investments and discuss the results.
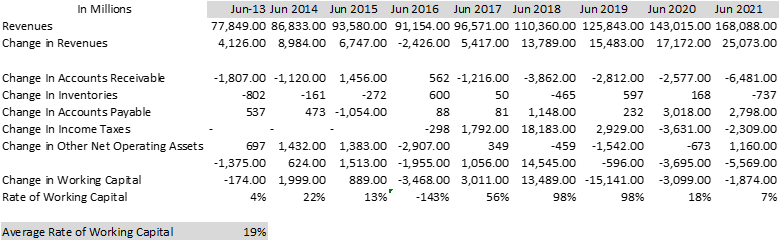
Next up, working capital for Microsoft.
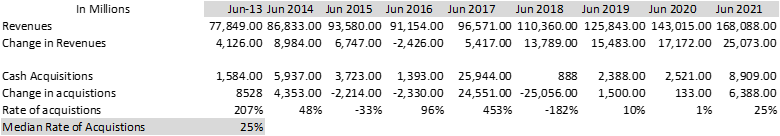
And lastly, we will look at the rate of acquisitions versus sales.
Now, let’s pull them together and look at them on a chart:
Item | Rate |
R&D Rate | 11.42% |
Fixed Capital Rate (median) | 4% |
Working Capital Rate | 19% |
Acquisition Rate | 25% |
By looking across the board, we can see that Microsoft has been investing in a broad range of areas over the last ten years, with acquisitions and working capital leading the way. It surprised me that R&D investments compared to sales over the last four years have steadily declined, especially with Microsoft’s cloud segment with Azure.
After we see which reinvestment rates the leaders are, we need to dig in and learn from investor presentations, and earnings calls what is driving these investments and the company’s goals regarding capital allocation. They could be looking to corner the market, add technical expertise, or add to current solutions.
In Microsoft’s case, Satya Nadella took charge in 2014, and you can see that R&D as a percentage of sales started to increase, but we also see acquisitions start to increase, including the purchase of LinkedIn in 2017. And as time has passed, that purchase is starting to bear fruit for the company. Typically, acquisitions take time to gain traction, especially revenue synergies.
If we look at other capital allocations, such as debt paydown, dividends, and share purchases, we see:
Item | Total Spent | Avg per year |
Debt paydown | $56.8 billion | $5.68 billion |
Dividends | $113.62 billion | $11.36 billion |
Buybacks | $140.52 billion | $14.05 billion |
The above charts outline the total cash allocations that Microsoft has returned to investors, and you can see that buybacks lead the way, both overall and by average. And if we compare that to Microsoft’s latest free cash flow for the TTM of $47.2 billion, we see that Microsoft can afford to return that cash to shareholders comfortably.
Measuring Capital Allocation with ROIC and ROIIC
The next segment of assessing capital allocation is an analysis of ROIC (return on invested capital) and ROIIC (return on incremental invested capital).
ROIC provides an overview of the company’s performance, and ROIIC focuses on the efficiency of capital spending. If you are unsure of how to calculate ROIC, please check out the below articles before continuing:
How to Calculate Invested Capital for ROIC (The Right Way)
In short, NOPAT, the numerator, assumes no financial leverage, allowing us to compare companies across industries.
Invested capital is the denominator we can look at in two different ways. One is the net assets necessary to run the business, and the other is the financing via debt and equity to fund those assets. You arrive at the same destination using either invested capital calculation, but I like to look at the net assets as it gives me a better framework of what drives the revenues.
ROIC is a great way to measure the value creation of any company, and the greater the gap between the ROIC and WACC (weighted average cost of capital), the greater the value Microsoft creates.
For example, Microsoft’s recent ROIC is:
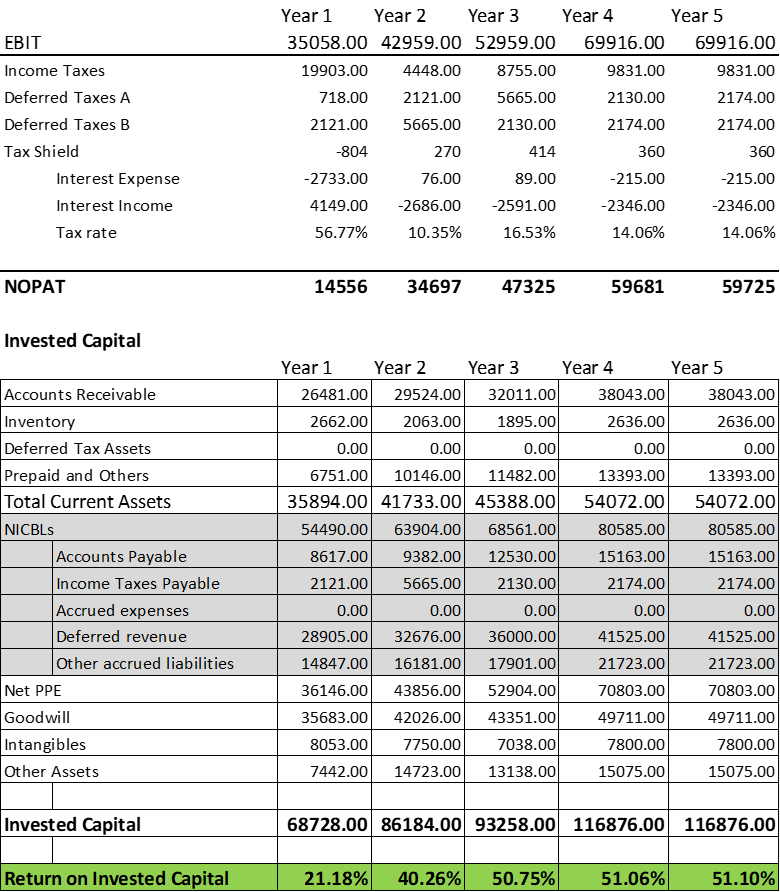
The company’s cost of capital, or WACC, is:

As we can see, Microsoft has created value well and above its cost of capital and a ton of value over the last five years. And ROIC tells us how efficiently Microsoft reinvests its capital to grow its revenues.
Studies have shown that companies that earn high returns on capital tend to have competitive advantages and create value for shareholders over time. Warren Buffett figured this out years ago, so he and Charlie look for wonderful companies at fair prices.
An easy way to calculate the ROIIC of Microsoft and any other company is to measure the change in NOPAT from one year to the other and compare that to the change in invested capital. That ratio tells us how efficiently the company reinvests its capital, and a recommended great practice is to look at the range over a longer period, say five years.
For example, Microsoft’s:
Item | Year 1 | Year 4 | Change |
NOPAT | 14,556 | 59,725 | 45,169 |
Invested Capital | 68,728 | 116,876 | 48,146 |
To calculate the ROIIC for the last four years for Microsoft, we divide the change in NOPAT, $45,169 million, and the change in invested capital of $48,146 million, which gives us (45,169/48,146) ROIIC of 93.81%.
A high ROIIC like Microsoft’s often indicates a capital-efficient business or that the company has significant operating leverage, such as Microsoft.
Calculating ROIC and ROIIC can help provide insights into a company’s past and future capital allocation. Remember that ROIIC is not a measure of economic profitability and is quite volatile; using ROIC compared to the cost of capital is a much better indication of future returns. ROIIC is a good tool to measure the efficiency of reinvestment but not projecting future reinvestments.
Incentives and Corporate Governance’s Impact on Capital Allocation
Charlie Munger, a huge proponent of learning incentives, constantly discusses one of the important economic lessons that incentives matter.
In the context of studying management’s capital allocation skills and understanding their incentives, you will also understand what motivates them to operate as they do.
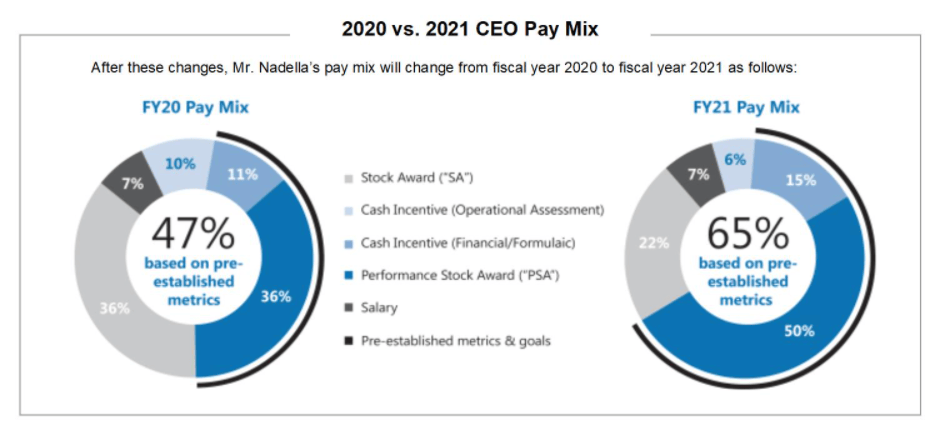
The management is motivated to improve the company’s position, price, and returns because they stand to gain from a salary perspective, plus any stock options they receive for performance.
As individual investors, we can study a company’s incentives and governance in the company’s proxy. Here, the company outlines what drives the management in the form of compensation. The proxy outlines what metrics measure the management’s performance and what they stand to gain if they hit those targets.
A great practice is to read through the proxy to determine what metrics the board believes will motivate the management to drive the company for both shareholders and the company.
For example, Satya Nadella gets measured on the following metrics:
- Revenue growth
- Operating income growth
- Commercial cloud growth
- Commercial cloud subscribers
- Team’s Monthly active usage
- Xbox Game Pass subscribers
- Surface revenue
- LinkedIn Sessions
The proxy will also list the competitors that Microsoft’s board judges management against, for example:
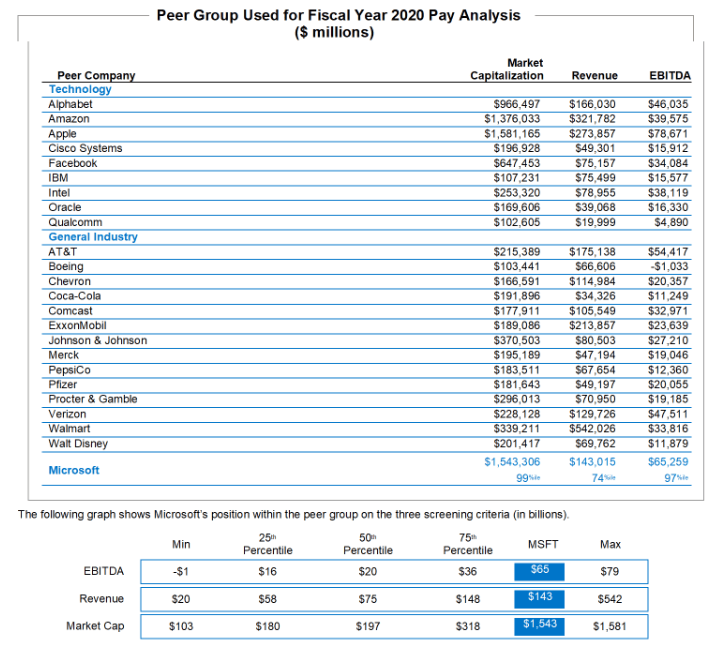
Using the above chart is a great way to measure different metrics for Microsoft and give you other companies to analyze.
To learn more about this important document and how it can help us analyze management’s decisions, check out this article:
Disney Board of Directors, Management Decisions: Analyzed [Investor Guide]
Bottom line, three components of management’s incentive programs support careful capital allocation:
- Compensating senior management with stock options or restricted stock (RSU) tied to either stock performance or peer group.
- Compensating Any executives or front-line employees that run operating units for exceeding long-term goals, including sales growth, operating margin expansion, or ROIC, for example.
- Focus any compensation on achieving long-term goals.
Remember that incentives are an important determining factor in behavior, and analyze whether management is committed to delivering long-term value by examining their actions, words, and incentives.
Investor Takeaway
Investing is a tough game, and analyzing a company encompasses many factors. One of the forgotten aspects is analyzing management and what drives them.
Remember, when we invest, we buy a piece of each business, and we are also buying management, and we need to decide if we want to do business with them.
Capital allocation is one of the most critical skills a CEO and management team must execute. Following the ideas discussed today will help give you a handle on the company’s past and future capital allocation performance. The long-term returns for you and the company depend on the judicious use of that capital.
And with that, we will wrap up our discussion on assessing management’s capital allocation skills.
As always, thank you for taking the time to read today’s post, and I hope you find something of value in your investing journey. If I can further assist, please don’t hesitate to reach out.
Until next time, take care and be safe out there,
Dave

Dave Ahern
Dave, a self-taught investor, empowers investors to start investing by demystifying the stock market.
