Setting a reasonable discount rate is critical to getting a reasonable valuation. Like with history, I believe that getting context on averages, in this case the average discount rate, throughout a large portion of the stock market will help you figure out if your chosen discount rate is reasonable or not.
A discount rate is a small piece that is integral to a Discounted Cash Flow (DCF) valuation, which is also denoted as a “WACC” Weighted Average Cost of Capital, or Cost of Equity (if no debt involved).
Those topics discussed above are worth a read after this post for more insight and application of the average discount rates you’ll learn about today.
The Basics of the Discount Rate
If I had to explain a discount rate to someone who knew nothing about it, I’d first simplify it like this:
- A higher discount rate = lower valuation
- A lower discount rate = higher valuation
So, if you chose a higher (more conservative discount rate), the value of the cash flows that you are estimating are less. Same goes the other way.
Why do we need a discount rate in valuation?
Well the premise of an investment is sacrificing cash now to get a cash flow later. Ever heard of the phrase, “a bird in the hand is worth two in the bush”?
Depending on your discount rate (and its proximity to the average discount rate of top stocks in the S&P 500), that bird in the hand could actually be worth not as much as two in the bush, or four… and it’s the discount rate you choose that helps you decide that.
What the discount rate does is understand that there’s risks to “two in the bush” tomorrow. For example:
- Inflation could decrease the values of future cash flow
- Cash in your hand today could instead be invested in a less risky investment
- Cash in your hand today could instead be investing in a less volatile investment
Once you’ve factored those risks into your outlay of cash today, you get a rough estimate of a discount rate, which helps you estimate the valuation of the expected cash flows of the investment.
Components of the Discount Rate – Cost of Equity
A discount rate known as the Cost of Equity can be used for a debt free company, where you’re ignoring the impact of debt in the discount rate.
There’s a particular formula that’s widely accepted to determine a Cost of Equity (or discount rate for the equity), and it’s called the CAPM formula. You can follow that link to learn the nitty-gritty behind the formula, but I’ll display it here for our purposes:
Notice that there’s 3 components of the Cost of Equity that all contribute to the discount rate, and are partly sourced from the risks of the “birds in the bush”.
- Risk-free rate: Encompasses the risk of not investing in a less risky investment
- Beta: Measures the expected volatility of the investment you’re evaluating
- Market risk premium: the return you prefer in order to compensate you for taking higher risks
Notice that some of these components of the discount rate can be universally applied to all stocks, such as the risk-free rate. While others, can’t: like beta, which depends on the individual stock.
And then you also have the market risk premium, which you could possibly manipulate or hold constant depending on investment choices, timelines, and many other factors.
But let’s keep it simple and leave it at that.
The Average Discount Rate of 50 Top Stocks in the S&P 500
To create this list, I wanted something that was more generally representative of the major sectors, industries, and businesses of the stock market, without being too stock market focused.
So while you’ll see a lot of the top stocks in terms of market capitalization on this list, there are also some that fell off of this industry map (which I wrote about in the link).
Most of the major sectors, with just a few top players, will be listed:

And now here’s the average discount rates of these stocks, which we will need to unpack as some should come with *asterisks. I pulled these numbers from the WACC calculation on Gurufocus.
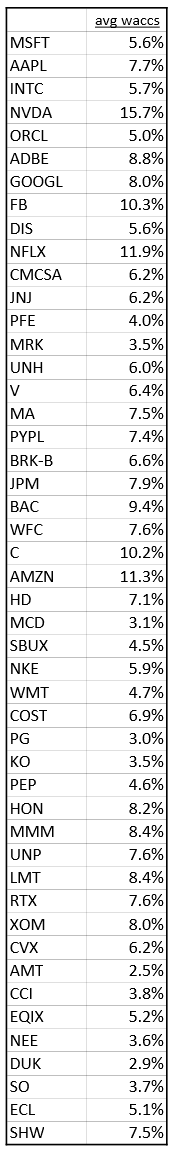
Note: it’s important to understand that Gurufocus calculates their WACC with a Cost of Equity formula that holds the market risk premium constant at 6%. Also, I pulled this data on 8/6/20, when the risk-free rate was at 0.55%, which would generally lead to lower discount rates in the aggregate.
First observation, without any adjustments:
- Average WACC = 6.6%
- Median WACC = 6.3%
Not only does the average discount rate here tell us that over this group of stocks, 6-7% seems reasonable, but also some logic will tell us that a wide variation in beta shouldn’t mean a wide variation in valuation. I discussed this in the CAPM post which I highly encourage you read.
But we need some reasonable upper and lower limits.
Discount Rate Limitations (Examples)
Take the difference between a stock with a beta of 1.0 and 0.5. It seems reasonable that the higher beta should be discounted more, since it is more volatile.
I’ll hold the risk-free rate constant at 0.55 (the one used for today’s data), and the market risk premium at 6% to keep this within the context of today.
- Beta = 1 –> Discount rate = 6%
- Beta = 0.5 –> Discount rate = 3.28%
Let’s take this one step further, adding a stock with a beta of 0.25 and 0.1 into the mix.
I’ll also show an example valuation of a company and the different fair value valuation differences depending on the chosen discount rate (this company will have $6.00 in Free Cash Flow per Share and a constant growth rate, say 10%).
- Beta = 0.25 –> Discount rate = 1.9% –> Fair Value = $238.08
- Beta = 0.1 –> Discount rate = 1.1% –> Fair Value = $261.77
- Beta = 0.5 –> Discount rate = 3.28% –> Fair Value = $203.37
- Beta = 1 –> Discount rate = 6% –> Fair Value = $152.35
The fair value of the stock fluctuates between $152.35 – $261.77 just by changing the beta further away from 1.0, representing a potential swing of 71.8% (or -41.8% to the downside).
That’s a huge difference in valuation, and could mean the difference between a great investment and a bad one.
And you also can’t forget that any stock that is negatively correlated with the stock market, (i.e. has a negative beta), will have a messy discount rate calculation (which could also go negative, blowing up the DCF) and should implement a lower limit too.
Finally, note that this distortion can happen in the opposite direction too, where an abnormally high beta can cause an unreasonably high discount rate.
So create an upper limit too.
What’s the Limit?
This can be up for debate, and you’ll get different answers everywhere.
- I think between 6-12% is the most reasonable discount rate across many interest rate, economic, and market cycles.
I mention 12% as an upper bound because it’s one quoted by conservative value investors before, such as Warren Buffett, who used the government bond rate as his discount rate during the 80’s—which got up to 12% at times.
As for the lower bound, I think that’s way more fun to talk about.
With ultra low interest rates in today’s environment, we’re seeing lots of companies with WACCs and Cost of Equity ratios at around 6%, with regular betas.
As it stands today, Market Risk Premium or Equity Risk Premium has been generally accepted (in textbooks and by practitioners) to be around 5-6% for a very long time, which leads to the 6% in an ultra-low interest rate environment.
But to go below that for the Cost of Equity, you need a beta below 1 to bring that down, and like I argued before, a lower beta isn’t always good.
So 6% is a great lower bound that gets reached at ultra low interest rates (pushing the risk-free rate to zero), without having distortions from misapplied betas.
One last thing (for those actually using discount rates)
I did some experimentation with a reverse DCF because I was curious how changing the discount rates and estimated growth rates change a valuation.
- Higher growth rates = higher valuations
- Lower discount rates = higher valuations
But which one matters more?
Well, by fixing my reverse DCF at a constant fair value, I found that lowering the discount rate by 1% affected the valuation the same (raising it) as about a 1.33% increase in growth rate.
In other words, a change in the discount rate of 1%, say from 6% –> 7%, would require an increase in the growth estimate by 1.33% to keep the valuation from changing.
So keep that in mind with these average discount rates shared today.
Adjust your models carefully, and with the right context, so you can understand why a valuation is being estimated as it is.
