Updated 4/21/2023
Operating margin is probably the most useful profitability ratio because it’s much less volatile than net margin but includes all operating expenses to run a business (which gross margin doesn’t).
Obviously, we want to see increasing operating margins over time. But how’s an investor to know if a company’s general levels of operating margin are good or not?
That’s where this post comes in.
- Introduction to Operating Margin
- Example of Operating Expenses: Apple
- Why Operating Margin is (and isn’t) Such a Useful Metric
- When Low Operating Margin Is Actually Preferred
- Average Operating Margin for the S&P 500 (2001-2022)
- Investor Takeaway
We will examine the average operating margin from 22 years of S&P 500 data and hopefully gain a valuable tool for comparing companies and their profitability.
Introduction to Operating Margin
The operating margin formula is the following:
Operating Margin = Operating Income / Revenue
Remember that all margin formulas are trying to describe how much $1 in sales will convert to either gross profit (gross margin), operating profit (operating margin), or net profit/ income (net margin).
So, how do we calculate operating income?
Most of the time, you should be able to find operating income in a company’s consolidated income statement wedged in between the top line (revenue) and bottom line (earnings). It’s also sometimes denoted on the income statement as EBIT (earnings before interest and taxes).
You can also derive operating income from revenue by subtracting the following:
Operating Income = Revenue – Cost of Goods Sold – Other Operating Expenses
Whereas, Other Operating Expenses = SG&A (selling, general, and administrative), R&D (research and development), and D&A (depreciation and amortization).
Let’s take a business that’s easy to quantify and show how to denote the difference between operating expenses and other expenses in the income statement.
Example of Operating Expenses: Apple
There are many parts of a business that contribute to the products that we love from Apple, such as the iPhone.
A product like the iPhone will embody the entire process of expenses; some get classified as operating expenses, and some do not.
Let’s start with how an iPhone is built.
There will have to be manufacturing and assembly plants to create an iPhone from its various component
(1) – COGs
The expenses associated with this part of the process get categorized under Costs of Goods Sold. Whether that’s the salaries of managers and employees working at the plant, the price to purchase these components or raw materials themselves, or even the shipping and transportation costs, will all generally flow to the Cost of Goods Sold.
It’s the first operating expense to consider, and it’s included in the operating margin. Think of Cost of Goods Sold as everything in the manufacturing process.
From there, we have a finished product, and the company needs to make money on the product.
(2) – SG&A
This is where Selling, General & Administration comes in. The company might hire a marketing agency to craft a masterful advertising campaign. They might hire employees to work the stores and sell and service the phones. They pay rent on the storefronts that are needed to sell the product to consumers.
All of the marketing with a product and service goes under SG&A, and is the second component of operating expenses to remember.
(3) – R&D
Thirdly, we have Research & Development.
In order to stay competitive in the market for smartphones, Apple needs to invest significant capital into R&D teams to experiment and innovate on features and technology for the iPhone. Though the impact of these expenses might not be apparent upfront, these are still annual expenses a company needs to pay as they pay their scientists and engineers.
You might be catching onto a trend here—much of operating expense is comprised of the necessary people who keep the business successful, whether that’s in manufacturing, selling, or planning for the future.
(4) – D&A
The last and final operating expense to consider is depreciation (& amortization).
If Apple wanted to build its own in-house factory instead of contracting it out to another company, it would need to invest a lot of capital in order to erect it. It might take multiple years of profits in order to invest in such a facility, and it might also generate multiples more of its expenses to build in the form of future profits.
Because large investments such as a facility (or other long-term assets, called Property, Plant, and Equipment) represent a huge upfront cost, it’s not a good representation to take that charge on a company’s financial statements all at once.
So, long-term investments into PPE assets are depreciated over multiple time periods; the expenses to build these assets are spread over many years instead of being charged into one.
It helps investors and business owners alike to see how a business is really performing from year-to-year. If long-term assets weren’t depreciated, companies would have huge, lumpy losses in their financials each time they made a significant investment, which isn’t much of an accurate description of the actual operating results of a business from year-to-year.
This depreciation charge reduces income, and specifically operating income, which is our last expense to consider.
Why Operating Margin is Such a Useful Metric
Operating income is often a chief focus of companies when they report earnings results, and it’s usually the only consistent metric you’ll find if you’re comparing multiple segments within a large corporation.
This is because as you move from Operating Income to Net Income, there are lots of other messy charges and additions to the numbers which can depart from the results of the underlying business.
Take taxes, for example. Taxes for a large corporation, especially one operating in multiple municipalities or countries, can be a nightmare to follow. The timing won’t always line up in a smooth fashion, making earnings lumpy. But because taxes aren’t part of operating income, we don’t have to worry about them mucking up Operating Income results from year to year.
Operating Income, and thus Operating Margin, is much cleaner than Net Income but also more descriptive than Gross Profit.
Because of this nature of the metrics, it’s easier to compare companies with each other and certainly between peers in an industry.
When Operating Margin Isn’t As Useful
But you also need to be careful about relying too much on Operating Margin and Operating Income and automatically assuming one company is better than another just because it has a larger Operating Margin.
The fact of the matter is that some businesses are inherently less expensive to run. Some technology companies, like those in software, don’t generally have to spend much on manufacturing since everything is in the virtual world of the internet and computers.
This makes gross margins higher, which flows down to operating margin.
Of course, a software company still needs to sell its products and services like anyone else and also needs to spend enough on R&D to remain relevant (and probably even more so than the average business).
But even after taking those parts of operating expenses into account, asset-light software companies tend to have higher operating margins than more capital-intensive firms. This does not automatically make them better or more valuable investments, however.
When Low Operating Margin Is Actually Preferred
A lower operating margin can actually be ideal for a company in certain situations.
For one, having lots of capital requirements can actually thwart competition because businesspeople might not want to deal or might have difficulty at times with acquiring enough capital to get started or continue to compete in such an environment.
Also, depending on the situation, the lower margins company might find a competitive moat simply from the fact that many other large businesses (who are more capital efficient) will probably stay away from such an industry, as they won’t get as high of a capital return on their investment in a low margins business than elsewhere.
That can be a great source of value for an investor particularly when the stock market is very expensive.
Where you do want to see a higher operating margin is compared to direct competitors. Business models can differ, but companies competing in the same market often face similar constraints, and oftentimes the better businesses tend to see their success play out in higher comparative operating margin.
That all said, yes, in general, you want to see a higher operating margin across the board.
Businesses that gush free cash flow through higher margins tend to be fantastic compounders of capital, due to how little reinvestment is needed through additional expenses and capex.
But to truly understand operating margin we have to look at both the positives and negatives, which we’ve done here; keep them in mind as we look at the average operating margin data.
Average Operating Margin for the S&P 500 (2001-2022)
In order to get a good sense for where the baseline operating margin falls, I took a look at the past operating margin for all of the current constituents of the S&P 500 (as of July 2021).
I did not adjust to add former constituents to the dataset, and so the fact that the operating margin starts to skew higher could be heavily influenced from companies who became weaker and left the S&P 500 and are not represented in this data.
Also, some financial companies such as banks were not included in this data.
| Year | Operating Margin (Median) |
|---|---|
| 2022 | 17.0% |
| 2021 | 17.6% |
| 2020 | 15.4% |
| 2019 | 15.9% |
| 2018 | 15.8% |
| 2017 | 15.7% |
| 2016 | 15.6% |
| 2015 | 15.5% |
| 2014 | 15.5% |
| 2013 | 15.2% |
| 2012 | 15.4% |
| 2011 | 15.4% |
| 2010 | 15.4% |
| 2009 | 13.2% |
| 2008 | 13.4% |
| 2007 | 14.7% |
| 2006 | 14.0% |
| 2005 | 13.3% |
| 2004 | 12.9% |
| 2003 | 11.4% |
| 2002 | 11.0% |
| 2001 | 10.7% |
| AVG | 14.5% |
The average for each of these annual figures over the complete 22-year period was 14.5%. Compare this to the 8.9% average from the research I did on historical average net margins.
A nice rule of thumb shortcut would be to remember that the net margin probably averages around 10%, and the operating margin averages around 5% more than that.
Simple and easy.
So a business with an operating margin of 20%+ is probably very capital efficient, while one with 5% or less is pretty capital intensive.
Average Operating Margin By Sector and Industry (2018-2022)
Let’s look at these by sector now, and observe those that are more capital efficient with those that are not so much.
| SECTOR | 2022 | 2021 | 2020 | 2019 | 2018 |
|---|---|---|---|---|---|
| Communications Services | 16.9% | 18.4% | 14.2% | 17.6% | 18.2% |
| Consumer Discretionary | 10.4% | -4.4% | -0.7% | 12.5% | 12.3% |
| Consumer Staples | 15.9% | 17.9% | 17.7% | 17.4% | 17.4% |
| Energy | 26.3% | 20.9% | 3.5% | 12.9% | 15.1% |
| Financials | 18.9% | 24.7% | 19.6% | 22.0% | 19.5% |
| Health Care | 19.3% | 20.3% | 17.8% | 18.0% | 17.1% |
| Industrials | 16.7% | 16.4% | 11.9% | 15.5% | 16.2% |
| Information Technology | 23.9% | 23.6% | 21.1% | 21.6% | 22.0% |
| Materials | 17.0% | 16.6% | 13.4% | 13.2% | 14.1% |
| Real Estate | 28.5% | 27.1% | 24.1% | 29.5% | 29.7% |
| Utilities | 17.8% | 19.7% | 21.3% | 20.6% | 18.5% |
| Total (AVERAGE) | 18.7% | 17.2% | 14.5% | 18.0% | 17.9% |
It shouldn’t surprise us to see sectors like technology score average operating margins in the 20s, while sectors filled with capital intensive industries such as Industrials had years averaging closer to 15.
Note that the totals at the bottom for each year can wildly differ from the median Operating Margins up above for the entire S&P 500. This is a numerical average can be skewed wildly by one or two numbers, which is why I use medians instead of averages whenever I can. In the case of this data (using an Excel PivotTable), that’s not an option (that I’m aware of).
Now, onto some of the individual industries.
I screenshotted these from my 4k monitor, so I apologize if they are blurry for you. A couple of takeaways:
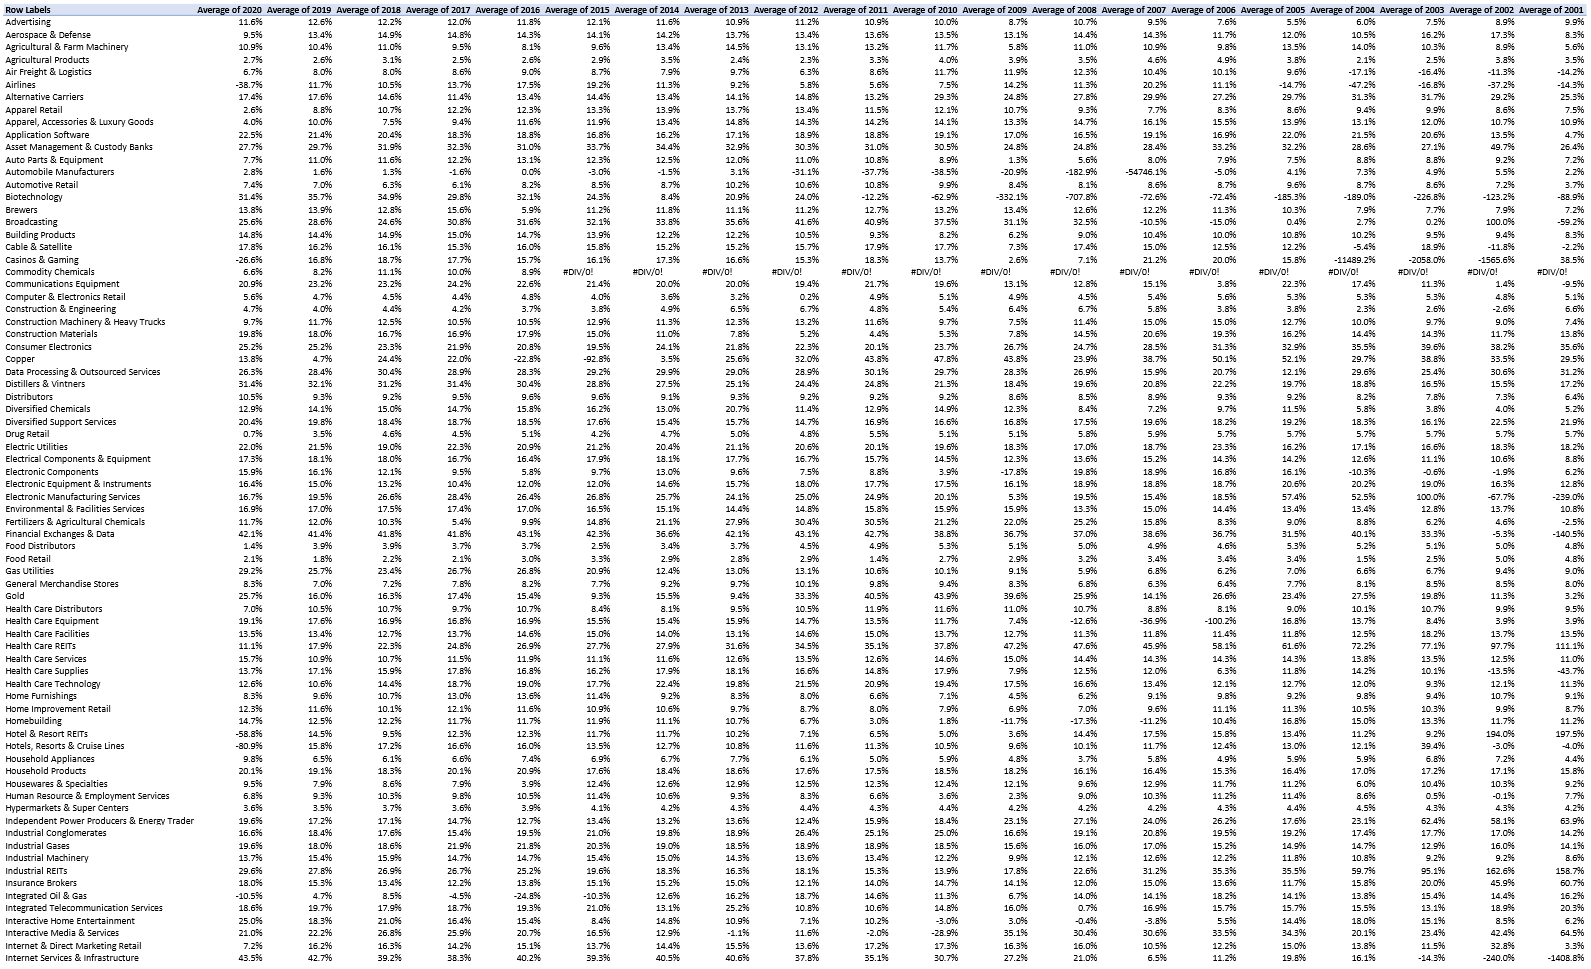
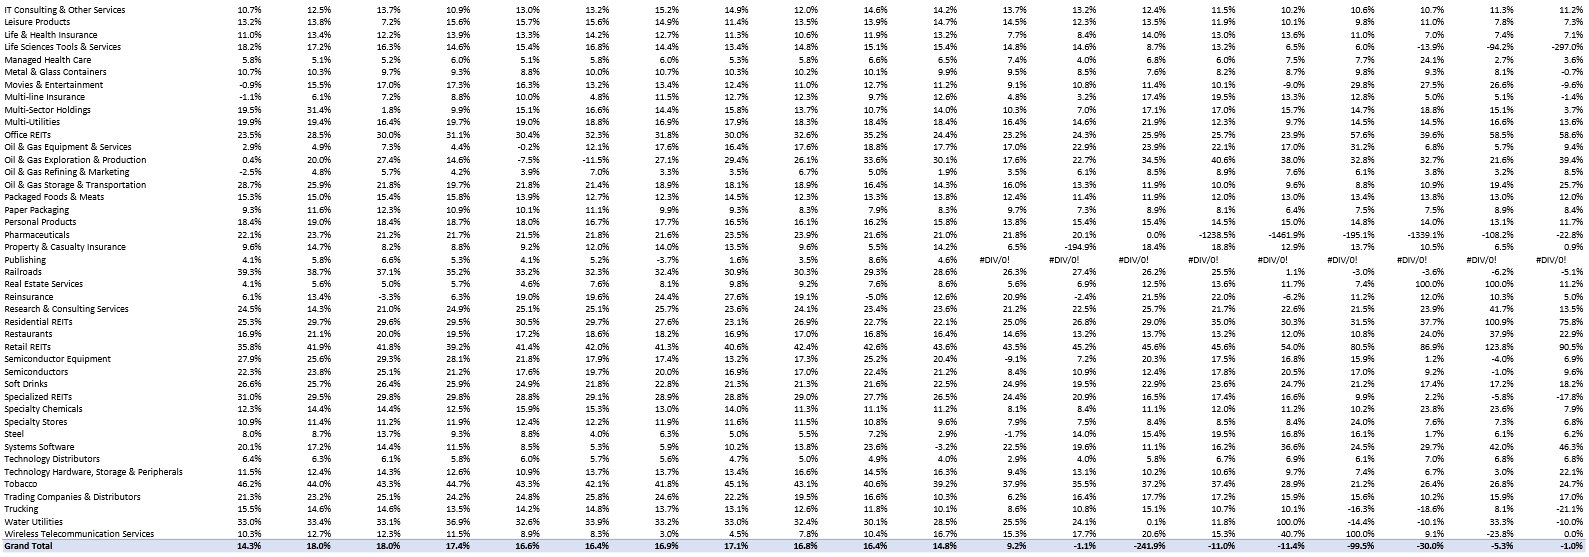
There’s quite a bit more variation on these industries.
25%+ wasn’t too uncommon, such as for industries such as Financial Exchanges and Data Processing. Low to mid single digits operating margins was also pretty common, such as Health Care Distributors and Oil & Gas Equipment and Services.
Investor Takeaway
All in all, it’s important to always compare operating margins apples-to-apples within an industry, and don’t use the metric in a silo.
That goes for all of the metrics we teach here on the blog.
Operating Income and its components are helpful in painting a picture on how well a business is performing and how strong its business model is over time, but that’s just one picture to the whole puzzle.
We still have to be diligent in learning about the actual businesses themselves, which takes going past the numbers and into the 10-k’s.
I know reading 10-k’s is not easy and overwhelming at first, but like Dave says, think of it like eating a pizza. You’re gonna want to go slice by slice.
Doing diligent research like that will go a long way in providing confidence and conviction in your investments when the going gets tough.
It’s hard to stay compelled about a company based solely on its numbers, especially when those great numbers temporarily disappear.
Learn business models, understand their competitive advantages, and think deeply about how each business can thrive. And then importantly, combine it with foundational investing principles such as diversification, dollar cost averaging, and long-term time horizons.
Have fun in the journey of the stock market and don’t get too caught up in the details if you’re feeling frustrated by them.
I hope this post has given you insight and encouragement along your way.

Andrew Sather
Andrew has always believed that average investors have so much potential to build wealth, through the power of patience, a long-term mindset, and compound interest.
