Post updated: 5/5/2023
The return on assets remains a useful measure for investors to understand. The formula offers a great way to measure the performance of management and generally is used to compare different companies in the same industry and how the company uses its assets.

Warren Buffett loves to invest in banks and insurance companies, which combine his competencies. For example, return on assets is one of the best ratios for determining a bank’s financial strength.
Each industry will have a differing return on assets, which we can best use when comparing companies within similar industries. Comparing Walmart’s return on assets to Apple’s doesn’t offer a useful comparison, nor would comparing Walmart to Wells Fargo.
In today’s post, we will explore:
- What is a Return on Assets (ROA)?
- How to Calculate Return on Assets
- Pros and Cons of Return on Assets
- Industry Return on Assets for Comparisons
What is Return on Assets?
Return on assets, otherwise known as ROA, is the ratio that shows how effectively a company utilizes its assets to generate a profit. Using the ROA, we can see how a company’s income relates to everything creating that income and how effectively it is using those assets.
The ratio helps us see how much profit compares to the assets; think of a ROA of 9% as nine cents for each dollar of assets; the higher, the better. The ratio will vary from industry and can be used to compare companies in similar industries.
The assets of return on assets refer to all items in the asset section of the balance sheet. Items such as cash, cash equivalents, marketable securities, property, inventories, and accounts receivables are all considered assets.
Return on assets also takes into account the company’s debt, unlike the return on equity ratio.
Comparing profits to incomes is useful, but the return on assets cuts to the bone of what every company strives for, comparing net income to the assets required to produce income and how effectively they create the income.
Higher return on assets means more asset efficiency; in this case, bigger is better.
How to Calculate Return on Assets
The formula for return on assets is simple to use and easy to find the data. The formula is:
Return on Assets (ROA) = Net income / Average total assets for a period
We will find the net income on the income statement and the total assets on the balance sheet. We will use the average of total assets for a period, either annual or quarters if you prefer. I like to use annuals to be consistent.
Let’s look at some companies’ financials and get an idea of how the return on assets works for several industries.
The first company I would like to look at is Microsoft. We will use the 10-K dated June 30, 2022, for our example.
I am taking a look first at the income statement. Before I forget, all the numbers listed will be in millions.
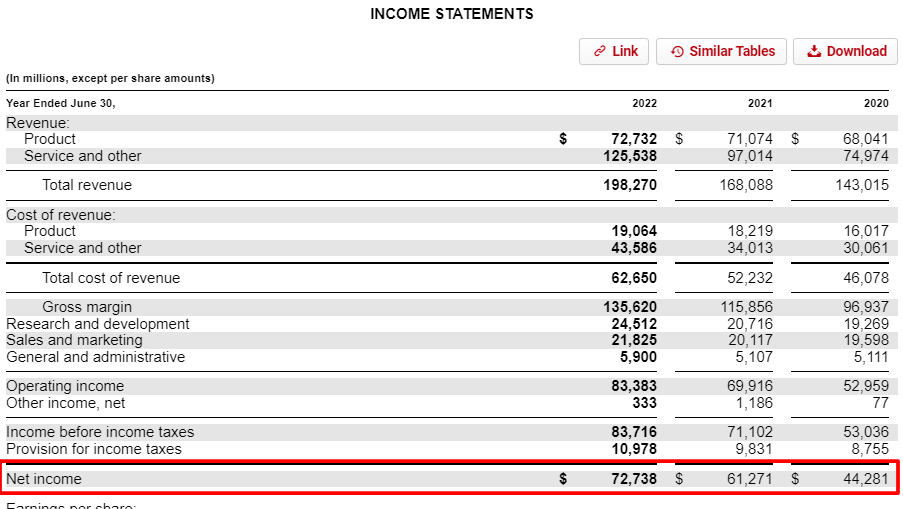
We see from the above picture that the income for Microsoft for the period ending June 2022 is $72,738.
Next, we will look at the balance sheet from the same 10-K.
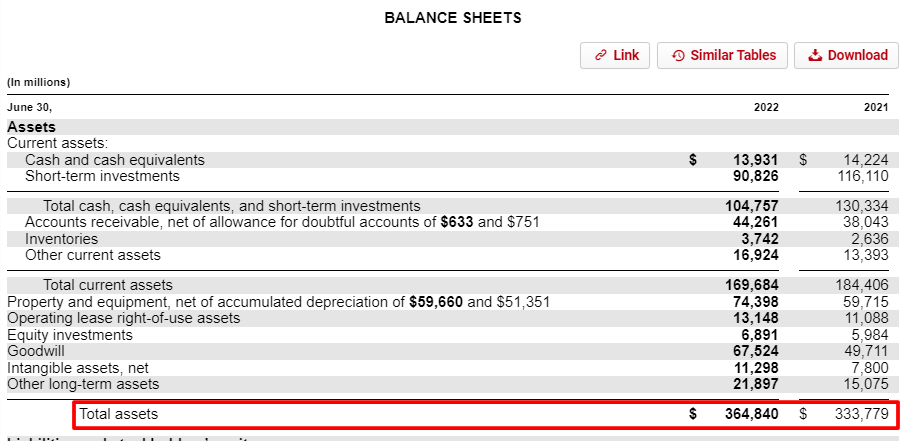
We can see from the balance sheet above that the total assets for 2022 and 2021 were:
- 2022 – $364,840 million
- 2021 – $333,779 million
Now that we have gathered all our numbers, let’s find the return on assets for Microsoft.
Return on assets = 72,738 / ( (364,840 + 333,779/2)
Return on assets = 72,738 / 349,310
Return on assets = 20.82%
Pretty easy, huh?
The ratio tells us Microsoft can create 20.82 cents for every dollar of its assets. We will discuss later how those ratios stack up to companies in Microsoft’s sector and their ranks.
Remember that we are looking for a higher number, regardless of the sector.
Let’s try another one.
How about Walmart? They are a huge retailer, and it would be interesting to see how their return on assets works.
We will use the latest 10-K for Walmart, dated January 31, 2022.
The income statement will show the net income for Walmart.
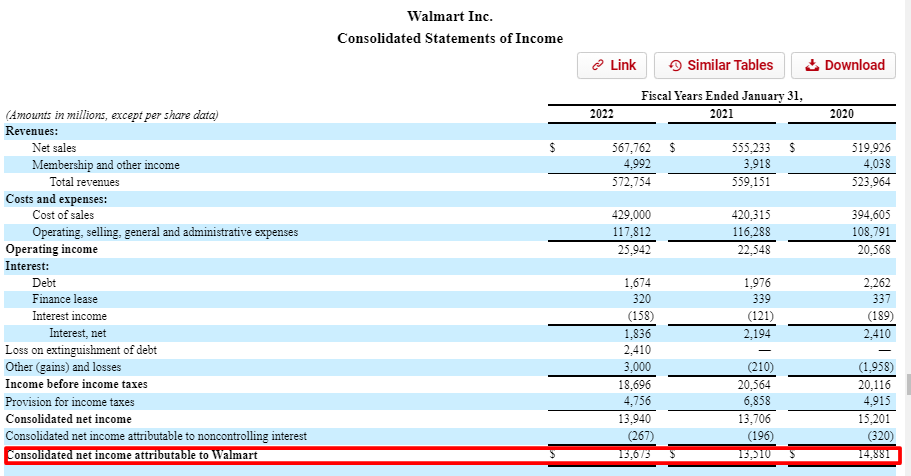
The net income for the year ending 2022 for Walmart is $13,673.
Next, we will look up the total assets for the same annual report.
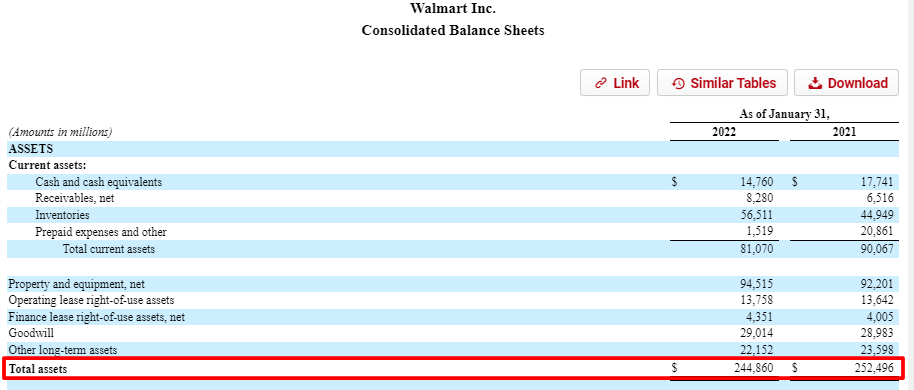
Walmart’s total assets for the periods ending 2021 and 2022:
- 2022 $244,860 million
- 2021 $252,496 million
Now that we have our numbers, let’s plug them into our formula to find the return on assets for Walmart.
Return on Assets = 13,673 / ((252,496 + 244,860) /2 )
Return on Assets = 13,673 / 248,678
Return on Assets = 5.49%
After calculating our ratio, we can see Walmart could generate 5.49 cents for every dollar of its assets. The return on assets is much lower for Walmart than for Microsoft, but does that offer a fair comparison?
Not really, because of the different nature of the assets for Walmart compared to Microsoft, which doesn’t offer an apples-to-apples comparison. Think about the nature of their businesses; Walmart portrays a retailer with huge inventories and huge accounts payables, whereas Microsoft portrays a software company that remains asset-light. Once they create a program or system, they can sell the product or service at costs much less to continue to sell the product.
Walmart has to buy more shoes to sell more shoes. In contrast, Microsoft has already created their cloud product Azure and can keep selling Azure without spending more; of course, they have to spend money to continue tweaking, but the spending is peanuts compared to creating the said product.
Ok, let’s try another. I want to look at AT&T to see how effectively they create income from their assets. We will use their latest 10-K, dated December 31, 2021.
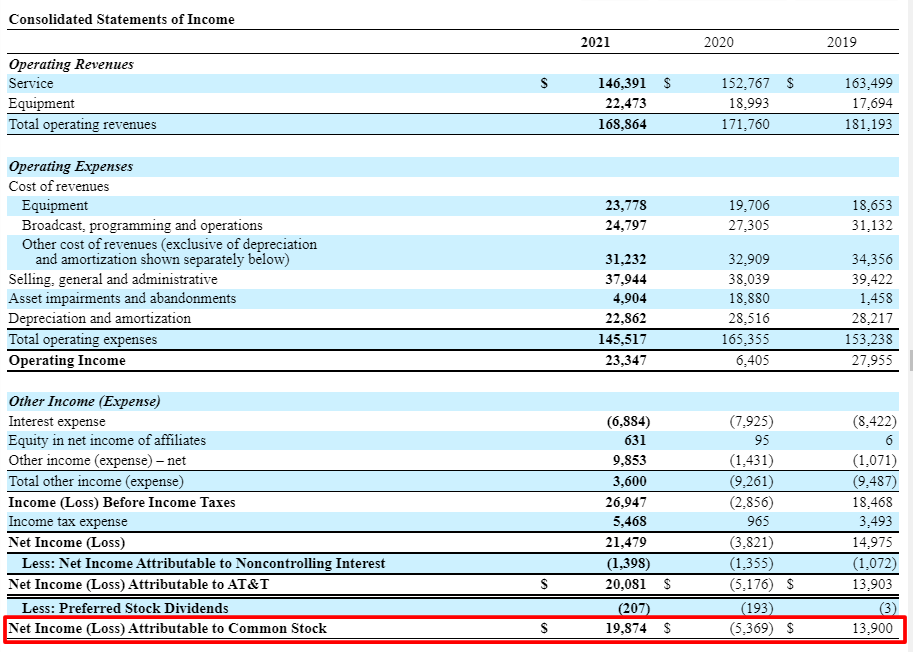
We can see from the above income statement that AT&T’s net income for 2021 was $19,874.
Next, look at their balance sheet to find their total assets.

We can see from the above balance sheet that AT&T’s total assets are:
- 2021 – $551,622
- 2020 – $525,761
Ok, let’s find the return on assets for AT&T.
Return on Assets = 19,874 / (( 551,622 + 525,761)/2)
Return on Assets = 19,874 / 538,691
Return on Assets = 3.69%
AT&T had a lower return on assets than Walmart and Microsoft. Does the lower ROA mean AT&T is worse than the others in creating profit from their assets? Not necessarily, but we will explore the idea more fully.
One item I would like you to notice is that the net income for AT&T has decreased over the last three years, which corresponds to a decline in their return on assets. It is always best to compare ratios over a longer period than one year or quarter. Small sample sizes can lead to misjudgments as the data is too small to make definitive statements.
I want to look at one more business, JP Morgan (JPM). Banks are a different breed, and their ROA tends to be much lower than other businesses.
We will use the latest 10-K for JP Morgan, dated December 31, 2022.
JP Morgan had a net income of $37,676 for the year ending 2022 and had total assets of:
- 2022 – $3,665,743
- 2021 – $3,743,567
Let’s find the return on assets for JP Morgan.
Return on Assets = 37,676 / (( 3,665,743 + 3,743,567 )/2)
Return on Assets = 37,676 / 3,704,655
Return on Assets = 1.02%
As we can see, JP Morgan had a much lower return on assets than Microsoft, but within range of AT&T. Remember that banks are a special beast of their own, and they must be treated as a special circumstance, and you must compare them to other financials.
Now that we have a handle on calculating return on assets, let’s look at some pros and cons.
Pros and Cons of Return on Assets
One comparison between return on assets and return on equity is the relationship to how both ratios show that a company utilizes its resources. Return on equity only measures the company’s equity, leaving out the liabilities. The more leverage and debt a company takes on, the higher the return on equity versus the return on assets.
Advantages of a Return on Assets:
- Return on assets uses a percentage, which makes it much easier to compare across industries and compare companies with different asset sizes.
- The ratio is fairly easy to calculate; the inputs are simple and easy to find on the financial reports, the income statement, and the balance sheet. Because of the ease of use, this ratio is easy to understand for non-accounting managers.
Disadvantages of using a return on assets:
- The main issue with using a return on assets is that we can’t use the ratio across industries. That’s because a company in tech and another in oil will have different asset bases.
- Some analysts feel that the basic ROA formula is limited in its applications, being better suited for banks. Bank balance sheets better illustrate the real value because they carry the value at market value. Or, at the very least, an estimate of their market value, or historical market value, because they already factor in interest expense and income. Both interest expense and interest income are terms specific to the banking industry.
- For non-financials, both debt and equity remain strictly separated.
There are additional formulas to calculate the return on assets for non-financial companies, but I like to keep it simple and consistent. The main strength of the ratio is the ability to assess the effectiveness of the profitability of the company quickly.
It is best used as a screener to weed out companies in an industry where you are looking for good investments. It can help you decide which is the better choice among several companies in the banking world, for example.
Industry Return on Assets for Comparison
Now let’s look at some listings by industry for return on assets. Then we can compare some of the companies we did earlier to their industry averages and look at others in their industry to see how they stack up.
| Sector | Return on Assets |
|---|---|
|
Technology |
12.08% |
|
Energy |
11.05% |
|
Basic Materials |
8.51% |
|
Consumer Non-Cyclical |
7.85% |
|
Capital Goods |
7.34% |
|
Retail |
6.37% |
|
Transportation |
6.18% |
|
Healthcare |
5.39% |
|
Consumer Discretionary |
5.00% |
|
Services |
3.85% |
Chart info provided by csimarket.com
Let’s look at a few comparisons using the companies we used above.
- AT&T – 4.3%
- Verizon – 5.3%
- Telecom Industry ROA average of 2.89%
The averages show that AT&T is above the industry average, whereas Verizon is slightly above the average. As I mentioned earlier, I believe that the decrease in net income has driven AT&Ts return on assets lower. The reason for a decrease would bear some investigation if we were interested in investing in AT&T, or you could switch to looking deeper at Verizon.
For banks, the St. Louis Fed provided US bank ROAs in the past, but unfortunately, they discontinued the data. Below we have a chart from Statista outlining ROAs for banks from 1996 to 2019.
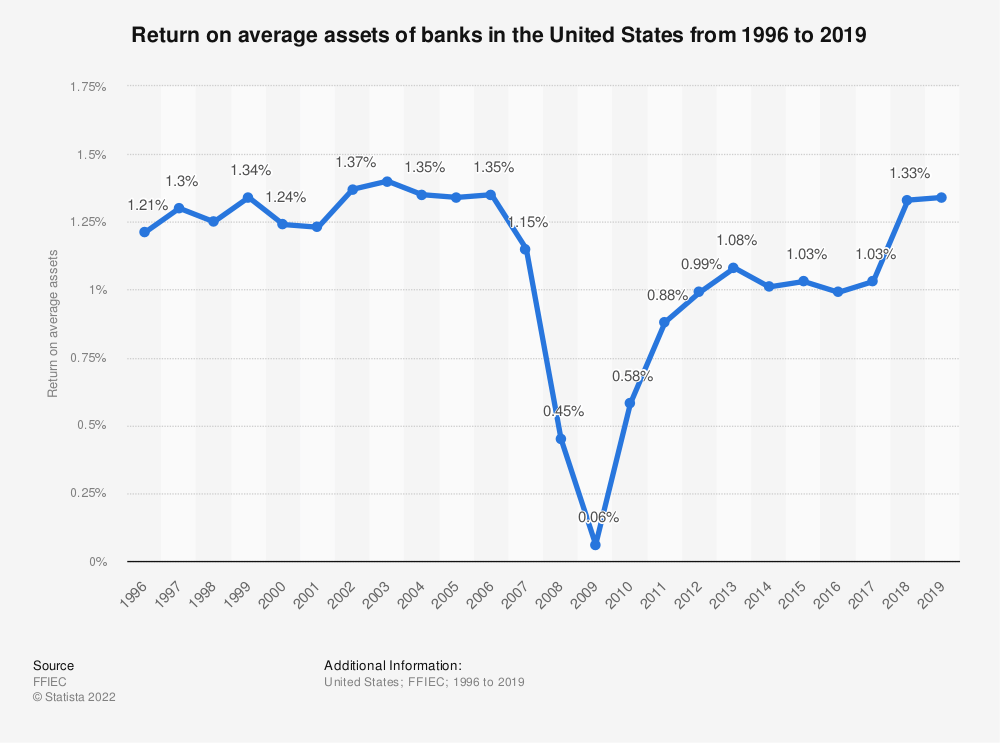
The banking industry’s average ROA is 1.16%
- JP Morgan 1.41%
- Wells Fargo 1.2%
- US Bank 1.4%
- Bank of America 1.1%
- Ally 1.7%
Looking at the above numbers, Ally and JP Morgan have performed best in using their assets effectively. Wells Fargo has been on the struggle bus lately with their legal woes.
The retail defensive industry average ROA is 4.88%
- Walmart 6.55%
- Costco 7.9%
- Target 10.8%
- Dollar General 7.7%
- Kroger 4.7%
Interestingly, even though Walmart is the largest retailer, all the companies listed, except Kroger, have performed better regarding return on assets.
The software industry average ROA is 7.07%
- Microsoft 14.9%
- Adobe 14.1%
- Oracle 8.2%
- IBM 2.5%
- Accenture 11.9%
As we can see, almost all listed companies have outperformed the industry average ROA except IBM. Microsoft has done well regarding ROA.
For comparison’s sake, the overall return on assets for the S&P 500 is 2.87%.
Final Thoughts
Return on assets is a simple, easy-to-use formula that gives us a ratio that we can use to analyze the effectiveness of any company. The ratio quickly tells how well a company uses its assets to create more profits.
It is also best used as a screener to find companies that use their assets more effectively than their peers. It is not a great tool for finding companies across different sectors, like a bank versus a retailer.

Return on assets is one of the main metrics I use when screening for banks, financials, brokerages, and insurance companies, as it tells me who is good at using their assets to create more profits. Banks, in particular, use the funds they gather to create more profits through lending. And insurance companies create more profits from the insurance premiums they gather from customers and use those premiums to invest in fixed-income securities or grow their float.
Calculating return on assets is easy and should be included as one of your screening tools as you search for companies to buy. It is especially useful in screening out competitors from each other. The key to screening companies is to find companies that are a hard no and move on to others. Return on assets can help in that endeavor.
That is going to wrap up our discussion on return on assets.
As always, thank you for taking the time to read this post, and I hope you find some value you can use on your investing journey.
If you have any questions or if I can be of any further assistance, please don’t hesitate to reach out.
Take care,
Dave

Dave Ahern
Dave, a self-taught investor, empowers investors to start investing by demystifying the stock market.
