There are many valuation multiples which investors use to compare stocks with their peers in an industry.
This post displays the mostly commonly used valuation multiples, showing average multiples of the S&P 500 by both sector and industry for Fiscal Year 2021 and 2020, as well as the 19 or 20-year historical averages (2002 – 2021).
These are the valuation multiples covered below (click to skip ahead):
- Average P/E Ratio
- Median P/E Ratio
- Average P/S Ratio
- Average P/FCF Ratio
- Average P/B Ratio
- Average PEG Ratio
Average P/E Ratio by Sector (FY 2020-2021)
The average P/E ratio of the S&P 500 was 29.0 in 2021, and 24.3 in 2020.
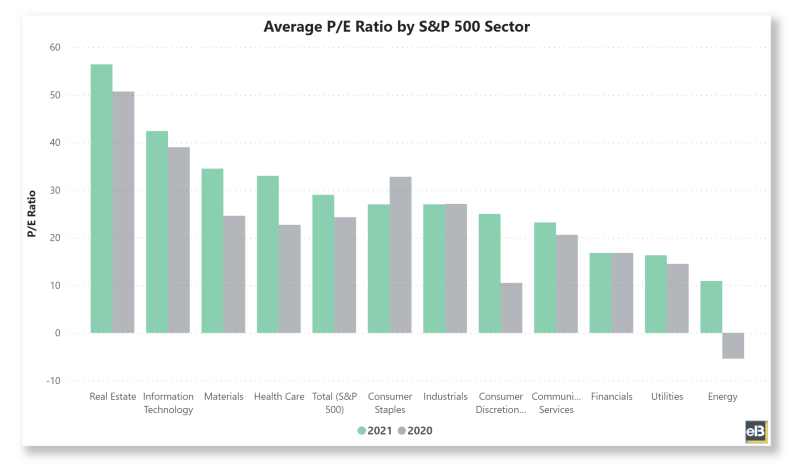
Here’s the breakdown for each S&P 500 sector for Fiscal Years 2020 and 2021:
| S&P 500 Sector | 2021 | 2020 |
| Communication Services | 23.2 | 20.6 |
| Consumer Discretionary | 25.0 | 10.5 |
| Consumer Staples | 27.0 | 32.8 |
| Energy | 10.9 | -5.4 |
| Financials | 16.8 | 16.8 |
| Health Care | 33.0 | 22.7 |
| Industrials | 27.0 | 27.1 |
| Information Technology | 42.4 | 39.0 |
| Materials | 34.5 | 24.6 |
| Real Estate | 56.4 | 50.7 |
| Utilities | 16.3 | 14.5 |
| Total (S&P 500) | 29.0 | 24.3 |
Source: Company filings and estimates from Sather Research LLC.
This data was pulled from quickfs.net’s premium plugin which pulls from publicly available company filings, and adjusted to ignore high and low numbers that would greatly skew the average, with any values above 250 or below -250 being deleted.
Due to the differing months for fiscal year period reporting schedules with all companies, each year’s figures may not fully represent the actual fiscal year displayed. All values represent current S&P 500 constituents and do not account for previous companies that have been dropped from the index.
The average P/E ratio for the energy sector in 2021 was 10.9, which is on the lower end of its historical average (on median terms), likely due to the great inflow of earnings for those businesses following a rebound from the pandemic in demand for oil and gas.

The average P/E ratio for tech stocks (information technology sector) of 42.4 in 2021 continues to outpace other sectors, with only the real estate sector seeing a higher average P/E in 2021 of 56.4. Tech stock P/E’s are being led by high P/E names like Autodesk, Fiserv, Microchip, Paycom Software, salesforce.com, and Tyler Technologies.
The average P/E ratio of 16.8 for the financial sector in 2021 was in-line with its results for 2020, showing a much lower P/E compared to the S&P average (29.0). The lower P/E average for financial stocks could be because investors perceive lower growth in the future, or the industry could simply be out of favor.
Median P/E Ratio by Sector (FY 2002-2021)
The median P/E ratio for the S&P 500 from 2003- 2021 ranged between 12.5- 23.6.
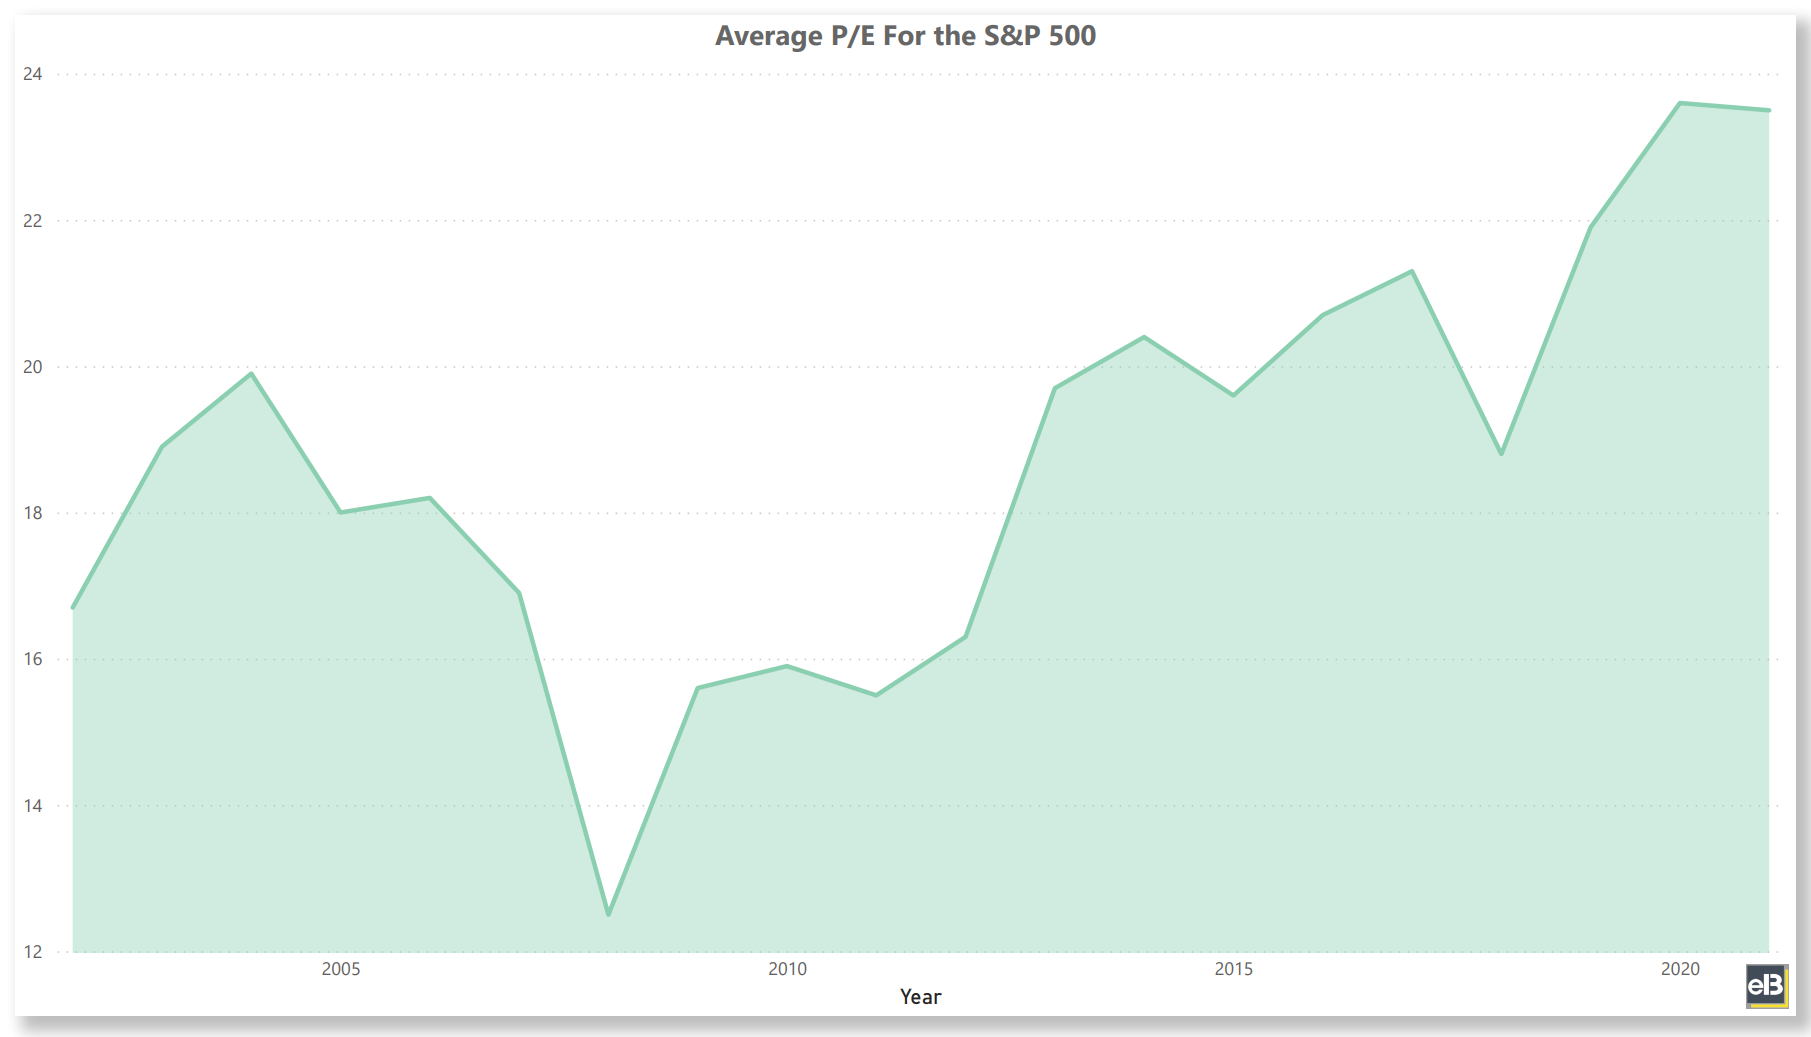
The tables below display the historical median P/E ratio for the S&P 500 by sector over the last 20 years, from Fiscal Years 2003-2021:
| S&P 500 Sector | 2021 | 2020 | 2019 | 2018 | 2017 | 2016 | 2015 | 2014 | 2013 | 2012 |
| Communication Services | 16.1 | 14.2 | 19.4 | 15.7 | 12.0 | 18.9 | 16.6 | 20.2 | 17.6 | 15.7 |
| Consumer Discretionary | 20.5 | 16.4 | 21.7 | 17.3 | 20.9 | 20.2 | 20.2 | 21.5 | 20.3 | 16.7 |
| Consumer Staples | 26.4 | 24.4 | 22.9 | 19.5 | 21.6 | 23.6 | 26.6 | 23.6 | 19.6 | 17.1 |
| Energy | 13.5 | -3.3 | 16.9 | 14.0 | 12.0 | -17.1 | -1.6 | 12.4 | 13.5 | 12.2 |
| Financials | 11.6 | 14.5 | 12.1 | 11.7 | 16.6 | 15.6 | 14.1 | 15.6 | 15.7 | 13.7 |
| Health Care | 28.4 | 25.2 | 28.0 | 27.1 | 31.9 | 27.3 | 26.0 | 23.4 | 20.6 | 15.7 |
| Industrials | 25.7 | 25.9 | 21.0 | 16.7 | 22.2 | 20.4 | 17.2 | 19.8 | 20.8 | 15.5 |
| Information Technology | 34.3 | 32.4 | 28.8 | 23.4 | 26.8 | 22.1 | 22.4 | 22.5 | 22.3 | 17.9 |
| Materials | 19.2 | 27.7 | 22.2 | 18.0 | 19.5 | 22.1 | 19.9 | 19.8 | 14.6 | 17.7 |
| Real Estate | 39.7 | 35.5 | 39.2 | 33.4 | 41.1 | 30.2 | 32.8 | 36.2 | 33.0 | 34.4 |
| Utilities | 20.5 | 20.2 | 22.6 | 19.1 | 19.4 | 19.6 | 17.5 | 18.5 | 15.7 | 15.1 |
| Total (S&P 500) | 23.5 | 23.6 | 21.9 | 18.8 | 21.3 | 20.7 | 19.6 | 20.4 | 19.7 | 16.3 |
| S&P 500 Sector | 2011 | 2010 | 2009 | 2008 | 2007 | 2006 | 2005 | 2004 | 2003 | 2002 |
| Communication Services | 12.9 | 16.0 | 15.2 | 7.9 | 20.1 | 22.7 | 19.5 | 20.6 | 22.8 | 22.3 |
| Consumer Discretionary | 18.1 | 16.3 | 14.0 | 12.2 | 15.3 | 16.5 | 17.2 | 18.0 | 20.0 | 14.2 |
| Consumer Staples | 16.3 | 14.5 | 14.5 | 15.5 | 19.0 | 19.8 | 18.8 | 20.7 | 18.9 | 19.4 |
| Energy | 10.8 | 15.0 | 14.7 | 6.8 | 12.4 | 9.4 | 9.5 | 8.6 | 9.3 | 10.4 |
| Financials | 11.6 | 14.1 | 14.5 | 11.5 | 13.3 | 15.0 | 15.9 | 14.9 | 15.4 | 16.4 |
| Health Care | 15.3 | 14.3 | 13.1 | 12.1 | 19.2 | 20.4 | 21.2 | 23.0 | 17.2 | 16.4 |
| Industrials | 13.4 | 18.5 | 18.4 | 11.2 | 16.1 | 17.1 | 18.4 | 21.1 | 22.3 | 18.6 |
| Information Technology | 16.6 | 18.0 | 19.7 | 15.4 | 22.0 | 23.2 | 24.3 | 32.0 | 25.1 | 19.8 |
| Materials | 14.2 | 16.2 | 15.9 | 12.6 | 16.0 | 18.5 | 16.0 | 20.1 | 21.7 | 18.8 |
| Real Estate | 36.7 | 42.0 | 24.3 | 19.0 | 19.2 | 28.4 | 20.1 | 24.2 | 18.7 | 16.0 |
| Utilities | 15.4 | 13.7 | 13.6 | 11.4 | 15.0 | 15.8 | 15.9 | 16.1 | 14.3 | 12.4 |
| Total (S&P 500) | 15.5 | 15.9 | 15.6 | 12.5 | 16.9 | 18.2 | 18.0 | 19.9 | 18.9 | 16.7 |
Source: Company filings and estimates from Sather Research LLC.
Median P/E’s are arguably a better measure of the overall index because it takes the middle point of the group, which roughly shows where the P/E for each company is closer to statistically.
S&P 500: Average P/E Ratio by Industry (Fiscal Years 2020-2021)
The average P/E ratio for the S&P 500 in 2021 was 23.5.
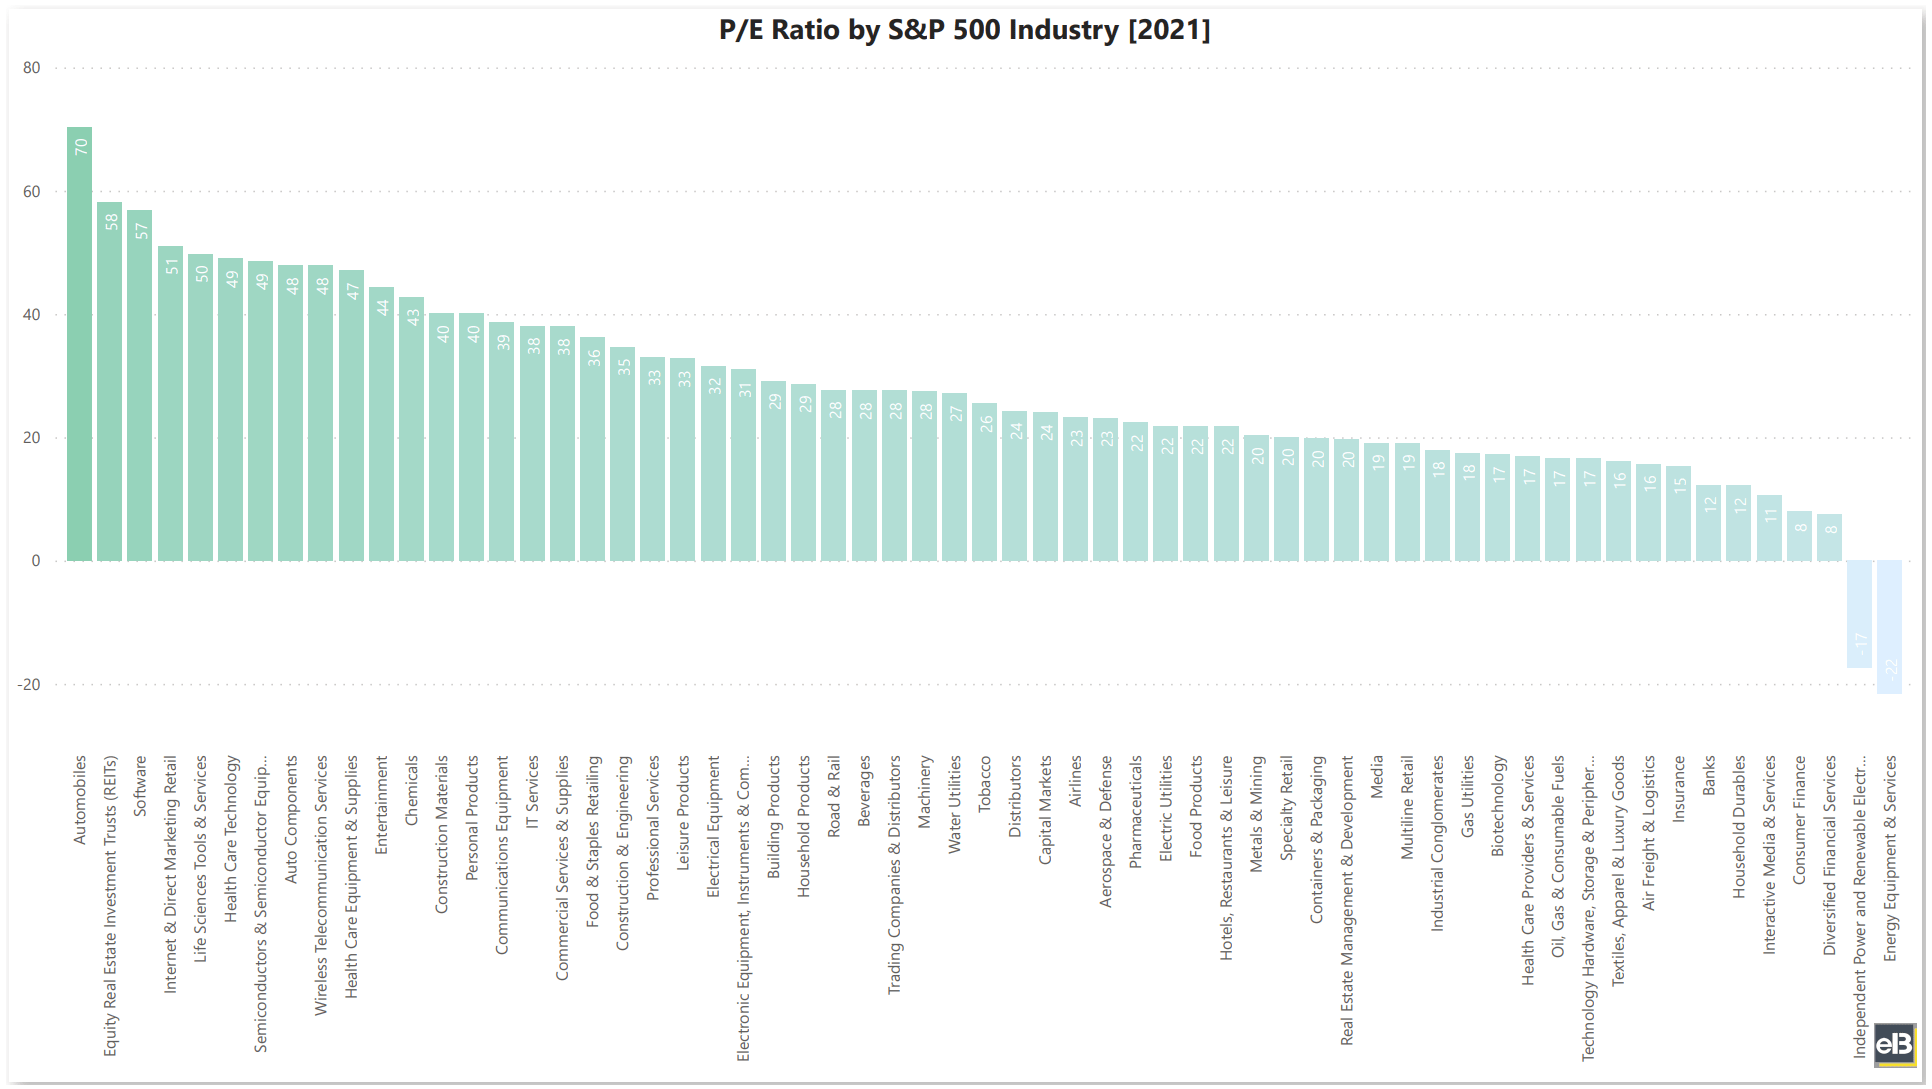
The following is a breakdown of the average P/E ratio of the S&P 500 by industry:
| S&P 500 Industry | 2021 | 2020 |
| Aerospace & Defense | 23.1 | 18.5 |
| Air Freight & Logistics | 15.7 | 45.8 |
| Airlines | 23.2 | -3.8 |
| Auto Components | 47.9 | 19.0 |
| Automobiles | 70.4 | -9.5 |
| Banks | 12.3 | 15.5 |
| Beverages | 27.6 | 23.9 |
| Biotechnology | 17.2 | -2.1 |
| Building Products | 29.1 | 28.3 |
| Capital Markets | 24.1 | 24.6 |
| Chemicals | 42.8 | 22.5 |
| Commercial Services & Supplies | 38.0 | 39.9 |
| Communications Equipment | 38.7 | 27.2 |
| Construction & Engineering | 34.7 | 23.4 |
| Construction Materials | 40.1 | 29.1 |
| Consumer Finance | 8.0 | 21.7 |
| Containers & Packaging | 19.8 | 24.2 |
| Distributors | 24.3 | 28.8 |
| Diversified Financial Services | 7.6 | 12.6 |
| Diversified Telecommunication Services | 8.3 | -11.5 |
| Electric Utilities | 21.9 | 24.0 |
| Electrical Equipment | 31.6 | 30.4 |
| Electronic Equipment, Instruments & Components | 31.1 | 20.7 |
| Energy Equipment & Services | -21.6 | -3.4 |
| Entertainment | 44.4 | 12.4 |
| Equity Real Estate Investment Trusts (REITs) | 58.2 | 54.1 |
| Equity Real Estate Investment Trusts (REITs) | 56.7 | 41.8 |
| Food & Staples Retailing | 36.2 | 55.8 |
| Food Products | 21.8 | 27.8 |
| Gas Utilities | 17.5 | 20.0 |
| Health Care Equipment & Supplies | 47.1 | 27.9 |
| Health Care Providers & Services | 16.9 | 13.7 |
| Health Care Technology | 49.0 | 30.8 |
| Hotels, Restaurants & Leisure | 21.8 | -10.0 |
| Household Durables | 12.2 | 10.9 |
| Household Products | 28.7 | 25.2 |
| Independent Power and Renewable Electricity Producers | -17.4 | 18.0 |
| Industrial Conglomerates | 18.0 | 28.4 |
| Insurance | 15.4 | 9.3 |
| Interactive Media & Services | 10.6 | 59.3 |
| Internet & Direct Marketing Retail | 51.1 | 34.9 |
| IT Services | 38.1 | 41.5 |
| Leisure Products | 32.8 | 57.7 |
| Life Sciences Tools & Services | 49.8 | 45.7 |
| Machinery | 27.5 | 29.9 |
| Media | 19.1 | 13.8 |
| Metals & Mining | 20.3 | 34.2 |
| Multiline Retail | 19.1 | 18.7 |
| Multi-Utilities | 13.9 | -3.8 |
| Oil, Gas & Consumable Fuels | 16.6 | -5.8 |
| Personal Products | 40.1 | 99.5 |
| Pharmaceuticals | 22.4 | 19.7 |
| Professional Services | 33.0 | 38.6 |
| Real Estate Management & Development | 19.7 | 28.0 |
| Road & Rail | 27.7 | 28.7 |
| Semiconductors & Semiconductor Equipment | 48.6 | 46.9 |
| Software | 56.8 | 57.1 |
| Specialty Retail | 20.1 | 25.3 |
| Technology Hardware, Storage & Peripherals | 16.6 | -3.6 |
| Textiles, Apparel & Luxury Goods | 16.2 | 9.5 |
| Tobacco | 25.5 | 16.5 |
| Trading Companies & Distributors | 27.6 | 27.4 |
| Water Utilities | 27.2 | 39.2 |
| Wireless Telecommunication Services | 47.9 | 54.7 |
| Total (S&P 500) | 29.0 | 24.3 |
Source: Company filings and estimates from Sather Research LLC.
Again, this data was pulled from quickfs.net’s premium plugin which pulls from publicly available company filings, and adjusted to ignore high and low numbers that would greatly skew the average, with any values above 250 or below -250 being deleted.
Due to the differing months for fiscal year period reporting schedules with all companies, each year’s figures may not fully represent the actual fiscal year displayed. All values represent current S&P 500 constituents and do not account for previous companies that have been dropped from the index.
The link for a screenshot of the entire 20 year dataset from Fiscal Years 2002 – 2021: Average P/E Ratio of the S&P 500 by Industry.
S&P 500: Average P/S Ratio by Sector (Fiscal Years 2020-2021)
The average P/S ratio of the S&P 500 was 4.6 in 2021, and 3.9 in 2020.
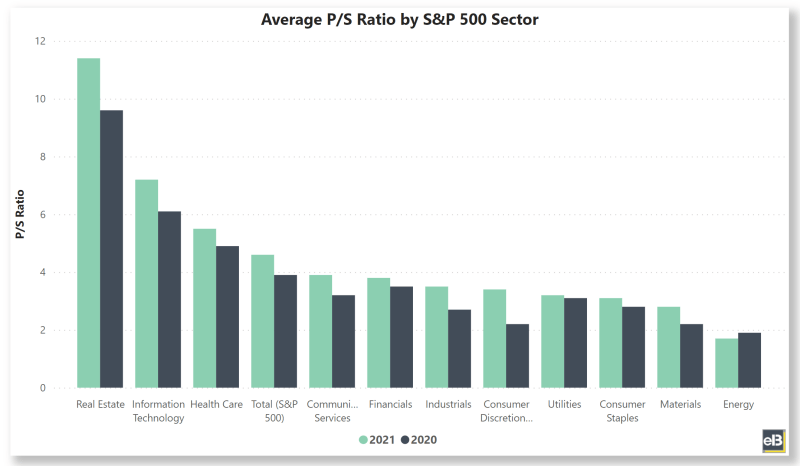
Below is the breakdown for each S&P 500 sector for Fiscal Years 2020 and 2021:
| S&P 500 Sector | 2021 | 2020 |
| Communication Services | 3.9 | 3.2 |
| Consumer Discretionary | 3.4 | 2.2 |
| Consumer Staples | 3.1 | 2.8 |
| Energy | 1.7 | 1.9 |
| Financials | 3.8 | 3.5 |
| Health Care | 5.5 | 4.9 |
| Industrials | 3.5 | 2.7 |
| Information Technology | 7.2 | 6.1 |
| Materials | 2.8 | 2.2 |
| Real Estate | 11.4 | 9.6 |
| Utilities | 3.2 | 3.1 |
| Total (S&P 500) | 4.6 | 3.9 |
Source: Company filings and estimates from Sather Research LLC.
This data was pulled from quickfs.net’s premium plugin which pulls from publicly available company filings, and adjusted to ignore high numbers that would greatly skew the average, with any values above 20 being deleted.
Due to the differing months for fiscal year period reporting schedules with all companies, each year’s figures may not fully represent the actual fiscal year displayed. All values represent current S&P 500 constituents and do not account for previous companies that have been dropped from the index.
The average P/S ratio for the energy sector in 2021 was 1.7, which was lower than its 2020 values and may represent the large selloff that occurred with those stocks during the steep drop in demand in the pandemic.
The average P/S ratio for tech stocks (information technology sector) of 7.2 in 2021 outpaces the other sectors just like with the Price to Earnings ratios, with only the real estate sector seeing a higher average P/S in 2021 of 11.4.
The average P/S ratio of 3.8 for the financial sector in 2021 is lower than the S&P average (4.6). This is consistent with the sector’s average P/E ratio and indicates less investor optimism across the board for these stocks.
S&P 500: Average P/S Ratio by Industry (Fiscal Years 2020-2021)
The average P/S ratio for the S&P 500 in 2021 was 4.6.

The following is a breakdown of the average P/S ratio of the S&P 500 by industry:
| S&P 500 Industry | 2021 | 2020 |
| Aerospace & Defense | 2.5 | 2.5 |
| Air Freight & Logistics | 1.2 | 1.1 |
| Airlines | 0.9 | 0.8 |
| Auto Components | 1.8 | 1.3 |
| Automobiles | 0.7 | 1.2 |
| Banks | 4.2 | 3.7 |
| Beverages | 5.9 | 5.0 |
| Biotechnology | 4.8 | 6.6 |
| Building Products | 2.8 | 2.2 |
| Capital Markets | 6.1 | 5.5 |
| Chemicals | 3.2 | 2.5 |
| Commercial Services & Supplies | 6.5 | 4.7 |
| Communications Equipment | 6.5 | 4.0 |
| Construction & Engineering | 1.2 | 0.7 |
| Construction Materials | 5.0 | 3.8 |
| Consumer Finance | 2.3 | 1.9 |
| Containers & Packaging | 1.5 | 1.4 |
| Distributors | 2.2 | 1.5 |
| Diversified Financial Services | 1.9 | 1.7 |
| Diversified Telecommunication Services | 1.1 | 1.4 |
| Electric Utilities | 3.3 | 3.1 |
| Electrical Equipment | 4.7 | 2.8 |
| Electronic Equipment, Instruments & Components | 4.5 | 3.2 |
| Energy Equipment & Services | 1.4 | 1.1 |
| Entertainment | 6.1 | 4.8 |
| Equity Real Estate Investment Trusts (REITs) | 11.0 | 9.8 |
| Equity Real Estate Investment Trusts (REITs) | 13.8 | 10.5 |
| Food & Staples Retailing | 0.6 | 0.5 |
| Food Products | 2.2 | 2.0 |
| Gas Utilities | 3.4 | 4.7 |
| Health Care Equipment & Supplies | 8.0 | 7.1 |
| Health Care Providers & Services | 0.8 | 0.7 |
| Health Care Technology | 4.7 | 4.0 |
| Hotels, Restaurants & Leisure | 6.0 | 2.9 |
| Household Durables | 1.7 | 1.5 |
| Household Products | 3.7 | 3.5 |
| Independent Power and Renewable Electricity Producers | 0.9 | 1.2 |
| Industrial Conglomerates | 4.4 | 3.9 |
| Insurance | 1.9 | 1.7 |
| Interactive Media & Services | 8.4 | 6.7 |
| Internet & Direct Marketing Retail | 6.7 | 4.1 |
| IT Services | 5.8 | 7.1 |
| Leisure Products | 2.2 | 3.1 |
| Life Sciences Tools & Services | 8.7 | 6.1 |
| Machinery | 3.4 | 2.6 |
| Media | 1.5 | 1.4 |
| Metals & Mining | 2.5 | 1.9 |
| Multiline Retail | 1.2 | 1.0 |
| Multi-Utilities | 2.9 | 3.0 |
| Oil, Gas & Consumable Fuels | 1.8 | 2.1 |
| Personal Products | 7.1 | 4.4 |
| Pharmaceuticals | 5.5 | 5.1 |
| Professional Services | 5.9 | 4.4 |
| Real Estate Management & Development | 1.3 | 0.9 |
| Road & Rail | 6.0 | 4.0 |
| Semiconductors & Semiconductor Equipment | 8.0 | 5.4 |
| Software | 11.8 | 9.5 |
| Specialty Retail | 1.9 | 1.6 |
| Technology Hardware, Storage & Peripherals | 2.3 | 1.6 |
| Textiles, Apparel & Luxury Goods | 2.4 | 2.0 |
| Tobacco | 4.4 | 4.6 |
| Trading Companies & Distributors | 3.5 | 2.3 |
| Water Utilities | 8.7 | 6.2 |
| Wireless Telecommunication Services | 1.8 | 1.5 |
| Total (S&P 500) | 4.6 | 3.9 |
Source: Company filings and estimates from Sather Research LLC.
Again, this data was pulled from quickfs.net’s premium plugin which pulls from publicly available company filings, and adjusted to ignore high numbers that would greatly skew the average, with any values above 20 being deleted.
Due to the differing months for fiscal year period reporting schedules with all companies, each year’s figures may not fully represent the actual fiscal year displayed. All values represent current S&P 500 constituents and do not account for previous companies that have been dropped from the index.
The link for a screenshot of the entire 19-year dataset from Fiscal Years 2003 – 2021: Average P/S Ratio of the S&P 500 by Industry.
S&P 500: Average P/FCF Ratio by Sector (Fiscal Years 2020-2021)
The average P/FCF ratio of the S&P 500 was 26.1 in 2021, and 23.0 in 2020.
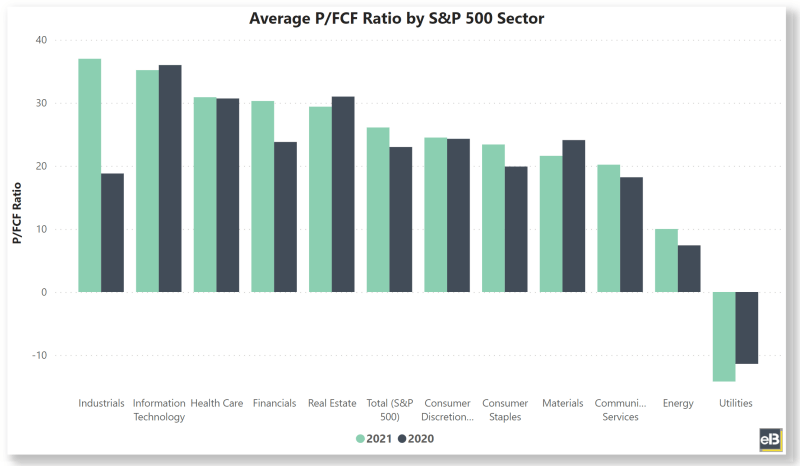
Below is the breakdown for each S&P 500 sector for Fiscal Years 2020 and 2021:
| S&P 500 Sector | 2021 | 2020 |
| Communication Services | 20.2 | 18.2 |
| Consumer Discretionary | 24.5 | 24.3 |
| Consumer Staples | 23.4 | 19.9 |
| Energy | 10.0 | 7.4 |
| Financials | 30.3 | 23.8 |
| Health Care | 30.9 | 30.7 |
| Industrials | 37.0 | 18.8 |
| Information Technology | 35.2 | 36.0 |
| Materials | 21.6 | 24.1 |
| Real Estate | 29.4 | 31.0 |
| Utilities | -14.2 | -11.4 |
| Total (S&P 500) | 26.1 | 23.0 |
Source: Company filings and estimates from Sather Research LLC.
Again, this data was pulled from quickfs.net’s premium plugin which pulls from publicly available company filings, and adjusted to ignore high and low numbers that would greatly skew the average, with any values above 250 or below -250 being deleted.
Due to the differing months for fiscal year period reporting schedules with all companies, each year’s figures may not fully represent the actual fiscal year displayed. All values represent current S&P 500 constituents and do not account for previous companies that have been dropped from the index.
The average P/FCF ratio for the energy sector in 2021 was 10.0, which was higher than its 2020 value of 7.4 and could be indicating higher reinvestment of cash flows into future growth.

The average P/FCF ratio for tech stocks (information technology sector) of 35.2 in 2021 outpaces the other sectors except for industrials, which saw a higher average P/FCF in 2021 of 37.0.
The average P/FCF ratio of -14.2 for the utilities sector is consistent with the trend of these businesses to be cash flow negative, and largely fund dividends by issuing shares and debt.
S&P 500: Average P/FCF Ratio by Industry (Fiscal Years 2020-2021)
The average P/FCF ratio for the S&P 500 in 2021 was 26.1.
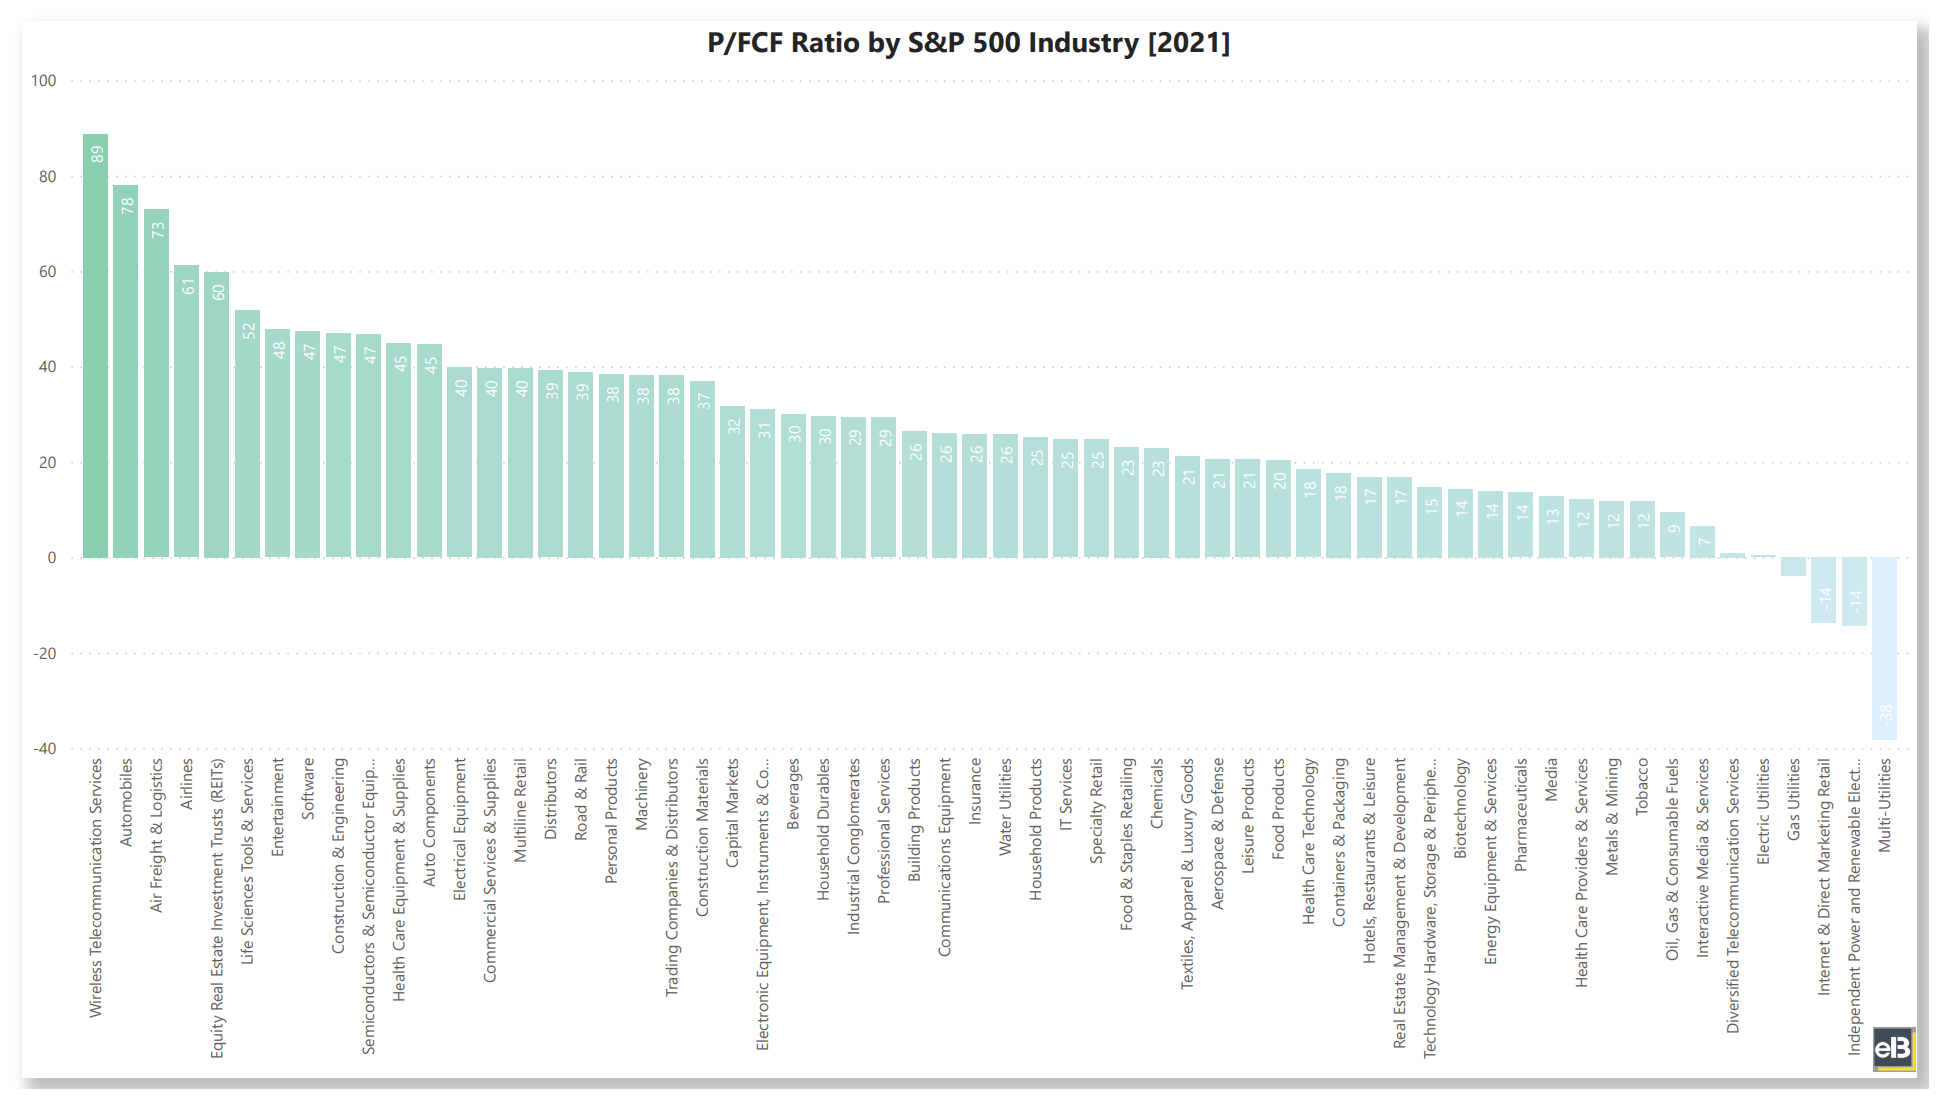
The following is a breakdown of the average P/FCF ratio of the S&P 500 by industry:
| S&P 500 Industry | 2021 | 2020 |
| Aerospace & Defense | 20.5 | 14.2 |
| Air Freight & Logistics | 72.9 | 9.3 |
| Airlines | 61.2 | -11.3 |
| Auto Components | 44.6 | 27.4 |
| Automobiles | 78.0 | 85.3 |
| Banks | ||
| Beverages | 30.1 | 28.3 |
| Biotechnology | 14.4 | 6.3 |
| Building Products | 26.4 | 20.4 |
| Capital Markets | 31.7 | 25.6 |
| Chemicals | 22.9 | 24.4 |
| Commercial Services & Supplies | 39.7 | 37.8 |
| Communications Equipment | 26.0 | 18.2 |
| Construction & Engineering | 46.9 | 14.3 |
| Construction Materials | 37.0 | 26.5 |
| Consumer Finance | ||
| Containers & Packaging | 17.7 | 26.4 |
| Distributors | 39.2 | 18.6 |
| Diversified Financial Services | ||
| Diversified Telecommunication Services | 0.9 | 7.8 |
| Electric Utilities | 0.4 | -11.4 |
| Electrical Equipment | 39.8 | 23.2 |
| Electronic Equipment, Instruments & Components | 31.0 | 29.3 |
| Energy Equipment & Services | 13.9 | 25.0 |
| Entertainment | 47.8 | 41.0 |
| Equity Real Estate Investment Trusts (REITs) | 29.8 | 34.8 |
| Equity Real Estate Investment Trusts (REITs) | 30.0 | 22.0 |
| Food & Staples Retailing | 23.1 | 16.8 |
| Food Products | 20.3 | 16.3 |
| Gas Utilities | -3.8 | -13.4 |
| Health Care Equipment & Supplies | 44.9 | 50.8 |
| Health Care Providers & Services | 12.1 | 9.8 |
| Health Care Technology | 18.4 | 20.8 |
| Hotels, Restaurants & Leisure | 16.9 | 22.5 |
| Household Durables | 29.6 | 12.4 |
| Household Products | 25.2 | 21.2 |
| Independent Power and Renewable Electricity Producers | -14.4 | 12.0 |
| Industrial Conglomerates | 29.4 | 29.1 |
| Insurance | 25.9 | 18.0 |
| Interactive Media & Services | 6.6 | 35.3 |
| Internet & Direct Marketing Retail | -13.7 | 24.9 |
| IT Services | 24.7 | 26.9 |
| Leisure Products | 20.5 | 15.1 |
| Life Sciences Tools & Services | 51.8 | 37.4 |
| Machinery | 38.1 | 19.1 |
| Media | 12.8 | 11.0 |
| Metals & Mining | 11.8 | 15.7 |
| Multiline Retail | 39.7 | 13.6 |
| Multi-Utilities | -38.2 | -19.9 |
| Oil, Gas & Consumable Fuels | 9.4 | 4.1 |
| Personal Products | 38.4 | 41.1 |
| Pharmaceuticals | 13.6 | 28.7 |
| Professional Services | 29.3 | 26.7 |
| Real Estate Management & Development | 16.8 | 13.5 |
| Road & Rail | 38.9 | 26.9 |
| Semiconductors & Semiconductor Equipment | 46.7 | 46.9 |
| Software | 47.4 | 48.4 |
| Specialty Retail | 24.7 | 11.5 |
| Technology Hardware, Storage & Peripherals | 14.8 | 24.8 |
| Textiles, Apparel & Luxury Goods | 21.2 | 44.3 |
| Tobacco | 11.8 | 11.7 |
| Trading Companies & Distributors | 38.1 | 19.9 |
| Water Utilities | 25.8 | 21.1 |
| Wireless Telecommunication Services | 88.8 | -69.9 |
| Total (S&P 500) | 26.1 | 23.0 |
Source: Company filings and estimates from Sather Research LLC.
Again, this data was pulled from quickfs.net’s premium plugin which pulls from publicly available company filings, and adjusted to ignore high and low numbers that would greatly skew the average, with any values above 250 or below -250 being deleted.
Due to the differing months for fiscal year period reporting schedules with all companies, each year’s figures may not fully represent the actual fiscal year displayed. All values represent current S&P 500 constituents and do not account for previous companies that have been dropped from the index.
The link for a screenshot of the entire 20 year dataset from Fiscal Years 2002 – 2021: Average P/FCF Ratio of the S&P 500 by Industry.
S&P 500: Average P/B Ratio by Sector (Fiscal Years 2020-2021)
The average P/B ratio of the S&P 500 was 4.7 in 2021, and 4.3 in 2020.

Below is the breakdown for each S&P 500 sector for Fiscal Years 2020 and 2021:
| S&P 500 Sector | 2021 | 2020 |
| Communication Services | 3.9 | 3.8 |
| Consumer Discretionary | 4.2 | 3.6 |
| Consumer Staples | 5.2 | 6.1 |
| Energy | 2.1 | 1.8 |
| Financials | 2.5 | 2.5 |
| Health Care | 6.0 | 4.7 |
| Industrials | 5.3 | 5.0 |
| Information Technology | 8.0 | 6.9 |
| Materials | 3.7 | 3.6 |
| Real Estate | 4.7 | 3.7 |
| Utilities | 2.3 | 2.4 |
| Total (S&P 500) | 4.7 | 4.3 |
Source: Company filings and estimates from Sather Research LLC.
This data was pulled from quickfs.net’s premium plugin which pulls from publicly available company filings, and adjusted to ignore high and low numbers that would greatly skew the average, with any values above 20 or below -20 being deleted.
Due to the differing months for fiscal year period reporting schedules with all companies, each year’s figures may not fully represent the actual fiscal year displayed. All values represent current S&P 500 constituents and do not account for previous companies that have been dropped from the index.
The average P/B ratio for the energy sector in 2021 was 2.1, which was higher than its 2020 values and could represent the large asset write-downs some companies had to take because of the lack of demand from the pandemic.
The average P/B ratio for tech stocks (information technology sector) of 8.0 in 2021 is the highest out of all stocks, and is due in large part to the higher returns on capital and higher margins that many businesses in this industry are able to achieve.
The average P/B ratio of 2.5 for the financial sector in 2021 is lower than the S&P average (4.7) and is typical of these highly balance sheet dependent businesses.
S&P 500: Average P/B Ratio by Industry (Fiscal Years 2020-2021)
The average P/B ratio for the S&P 500 in 2021 was 4.7.
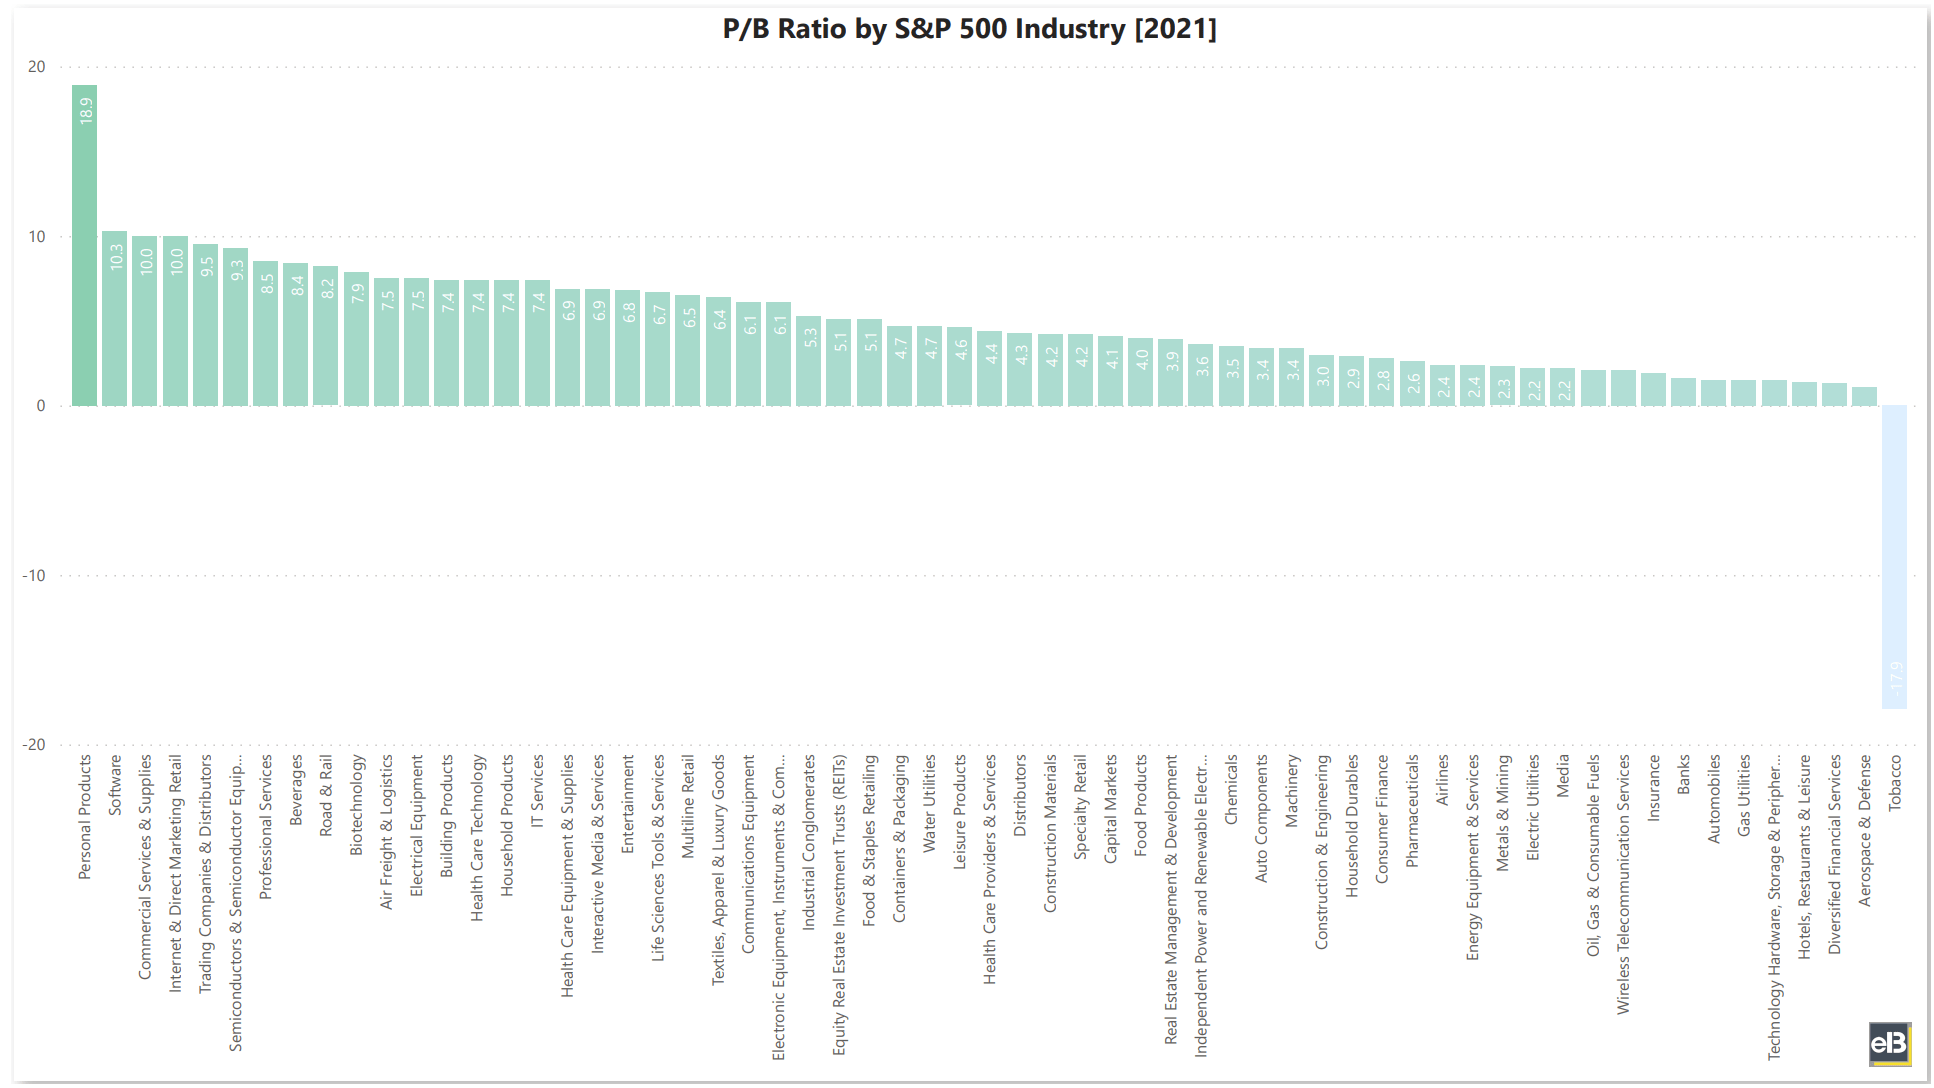
Here’s a breakdown of the average P/B ratio of the S&P 500 by industry:
| S&P 500 Industry | 2021 | 2020 |
| Aerospace & Defense | 1.1 | 3.3 |
| Air Freight & Logistics | 7.5 | 4.9 |
| Airlines | 2.4 | 2.3 |
| Auto Components | 3.4 | 3.9 |
| Automobiles | 1.5 | 4.1 |
| Banks | 1.6 | 1.4 |
| Beverages | 8.4 | 8.5 |
| Biotechnology | 7.9 | 4.0 |
| Building Products | 7.4 | 5.7 |
| Capital Markets | 4.1 | 3.9 |
| Chemicals | 3.5 | 3.7 |
| Commercial Services & Supplies | 10.0 | 8.3 |
| Communications Equipment | 6.1 | 4.7 |
| Construction & Engineering | 3.0 | 1.8 |
| Construction Materials | 4.2 | 3.3 |
| Consumer Finance | 2.8 | 2.3 |
| Containers & Packaging | 4.7 | 4.3 |
| Distributors | 4.3 | 3.2 |
| Diversified Financial Services | 1.3 | 1.3 |
| Diversified Telecommunication Services | 1.6 | 2.2 |
| Electric Utilities | 2.2 | 2.2 |
| Electrical Equipment | 7.5 | 4.5 |
| Electronic Equipment, Instruments & Components | 6.1 | 4.6 |
| Energy Equipment & Services | 2.4 | 1.8 |
| Entertainment | 6.8 | 7.7 |
| Equity Real Estate Investment Trusts (REITs) | 5.1 | 3.8 |
| Equity Real Estate Investment Trusts (REITs) | 3.6 | 3.3 |
| Food & Staples Retailing | 5.1 | 6.2 |
| Food Products | 4.0 | 5.1 |
| Gas Utilities | 1.5 | 2.4 |
| Health Care Equipment & Supplies | 6.9 | 6.3 |
| Health Care Providers & Services | 4.4 | 3.0 |
| Health Care Technology | 7.4 | 5.3 |
| Hotels, Restaurants & Leisure | 1.4 | 0.6 |
| Household Durables | 2.9 | 2.5 |
| Household Products | 7.4 | 6.2 |
| Independent Power and Renewable Electricity Producers | 3.6 | 4.2 |
| Industrial Conglomerates | 5.3 | 6.0 |
| Insurance | 1.9 | 2.4 |
| Interactive Media & Services | 6.9 | 4.3 |
| Internet & Direct Marketing Retail | 10.0 | 11.0 |
| IT Services | 7.4 | 5.9 |
| Leisure Products | 4.6 | 4.8 |
| Life Sciences Tools & Services | 6.7 | 5.2 |
| Machinery | 3.4 | 4.9 |
| Media | 2.2 | 2.2 |
| Metals & Mining | 2.3 | 1.4 |
| Multiline Retail | 6.5 | 4.6 |
| Multi-Utilities | 2.2 | 2.3 |
| Oil, Gas & Consumable Fuels | 2.1 | 1.8 |
| Personal Products | 18.9 | 15.0 |
| Pharmaceuticals | 2.6 | 4.4 |
| Professional Services | 8.5 | 6.7 |
| Real Estate Management & Development | 3.9 | 3.3 |
| Road & Rail | 8.2 | 5.1 |
| Semiconductors & Semiconductor Equipment | 9.3 | 7.5 |
| Software | 10.3 | 9.2 |
| Specialty Retail | 4.2 | 3.6 |
| Technology Hardware, Storage & Peripherals | 1.5 | 7.1 |
| Textiles, Apparel & Luxury Goods | 6.4 | 5.2 |
| Tobacco | -17.9 | 0.4 |
| Trading Companies & Distributors | 9.5 | 6.7 |
| Water Utilities | 4.7 | 3.6 |
| Wireless Telecommunication Services | 2.1 | 2.3 |
| Total (S&P 500) | 4.7 | 4.3 |
Source: Company filings and estimates from Sather Research LLC.
Again, this data was pulled from quickfs.net’s premium plugin which pulls from publicly available company filings, and adjusted to ignore high and low numbers that would greatly skew the average, with any values above 20 or below -20 being deleted.
Due to the differing months for fiscal year period reporting schedules with all companies, each year’s figures may not fully represent the actual fiscal year displayed. All values represent current S&P 500 constituents and do not account for previous companies that have been dropped from the index.
The link for a screenshot of the entire 19-year dataset from Fiscal Years 2003 – 2021: Average P/B Ratio of the S&P 500 by Industry.
S&P 500: Average PEG Ratio by Sector (Fiscal Years 2020-2021)
The average PEG ratio of the S&P 500 was 2.2 in 2021, and 2.2 in 2020.
Here’s the breakdown for each S&P 500 sector for Fiscal Years 2020 and 2021:
| S&P 500 Sector | 2021 | 2020 |
| Communication Services | 1.1 | 1.4 |
| Consumer Discretionary | 1.8 | 3.1 |
| Consumer Staples | 3.0 | 2.8 |
| Energy | -0.9 | -0.7 |
| Financials | 1.6 | 1.3 |
| Health Care | 2.9 | 1.8 |
| Industrials | 3.3 | 2.2 |
| Information Technology | 2.8 | 2.1 |
| Materials | 1.3 | 3.6 |
| Real Estate | 2.1 | 3.1 |
| Utilities | 2.3 | 2.2 |
| Total (S&P 500) | 2.2 | 2.2 |
Source: Company filings and estimates from Sather Research LLC.
This data was pulled from quickfs.net’s premium plugin which pulls from publicly available company filings, and adjusted to ignore high and low numbers that would greatly skew the average, with any values above 20 or below -20 being deleted.
Due to the differing months for fiscal year period reporting schedules with all companies, each year’s figures may not fully represent the actual fiscal year displayed. All values represent current S&P 500 constituents and do not account for previous companies that have been dropped from the index.
The average PEG ratio for the energy sector in 2021 was -0.9, with a negative value also of -0.7 in 2020. This indicates that the average growth for all stocks in the sector was negative over the last two years.
The average PEG ratio for tech stocks (information technology sector) of 2.8 in 2021 is surprisingly not the highest out of all the S&P 500 sectors, and trails Industrials, Consumer Staples, and Health Care. It shows that perhaps tech stocks aren’t as overvalued today as some investors make them out to be, as they do look expensive on traditional valuation multiples which aren’t considering growth such as P/E or P/B.
The average PEG ratio of 1.6 for the financial sector in 2021 is lower than the S&P average (2.2) and could indicate undervaluation today, especially as these stocks tend to look cheap on traditional valuation multiples as well.
S&P 500: Average PEG Ratio by Industry (Fiscal Years 2020-2021)
The average PEG ratio for the S&P 500 in 2021 was 2.2.
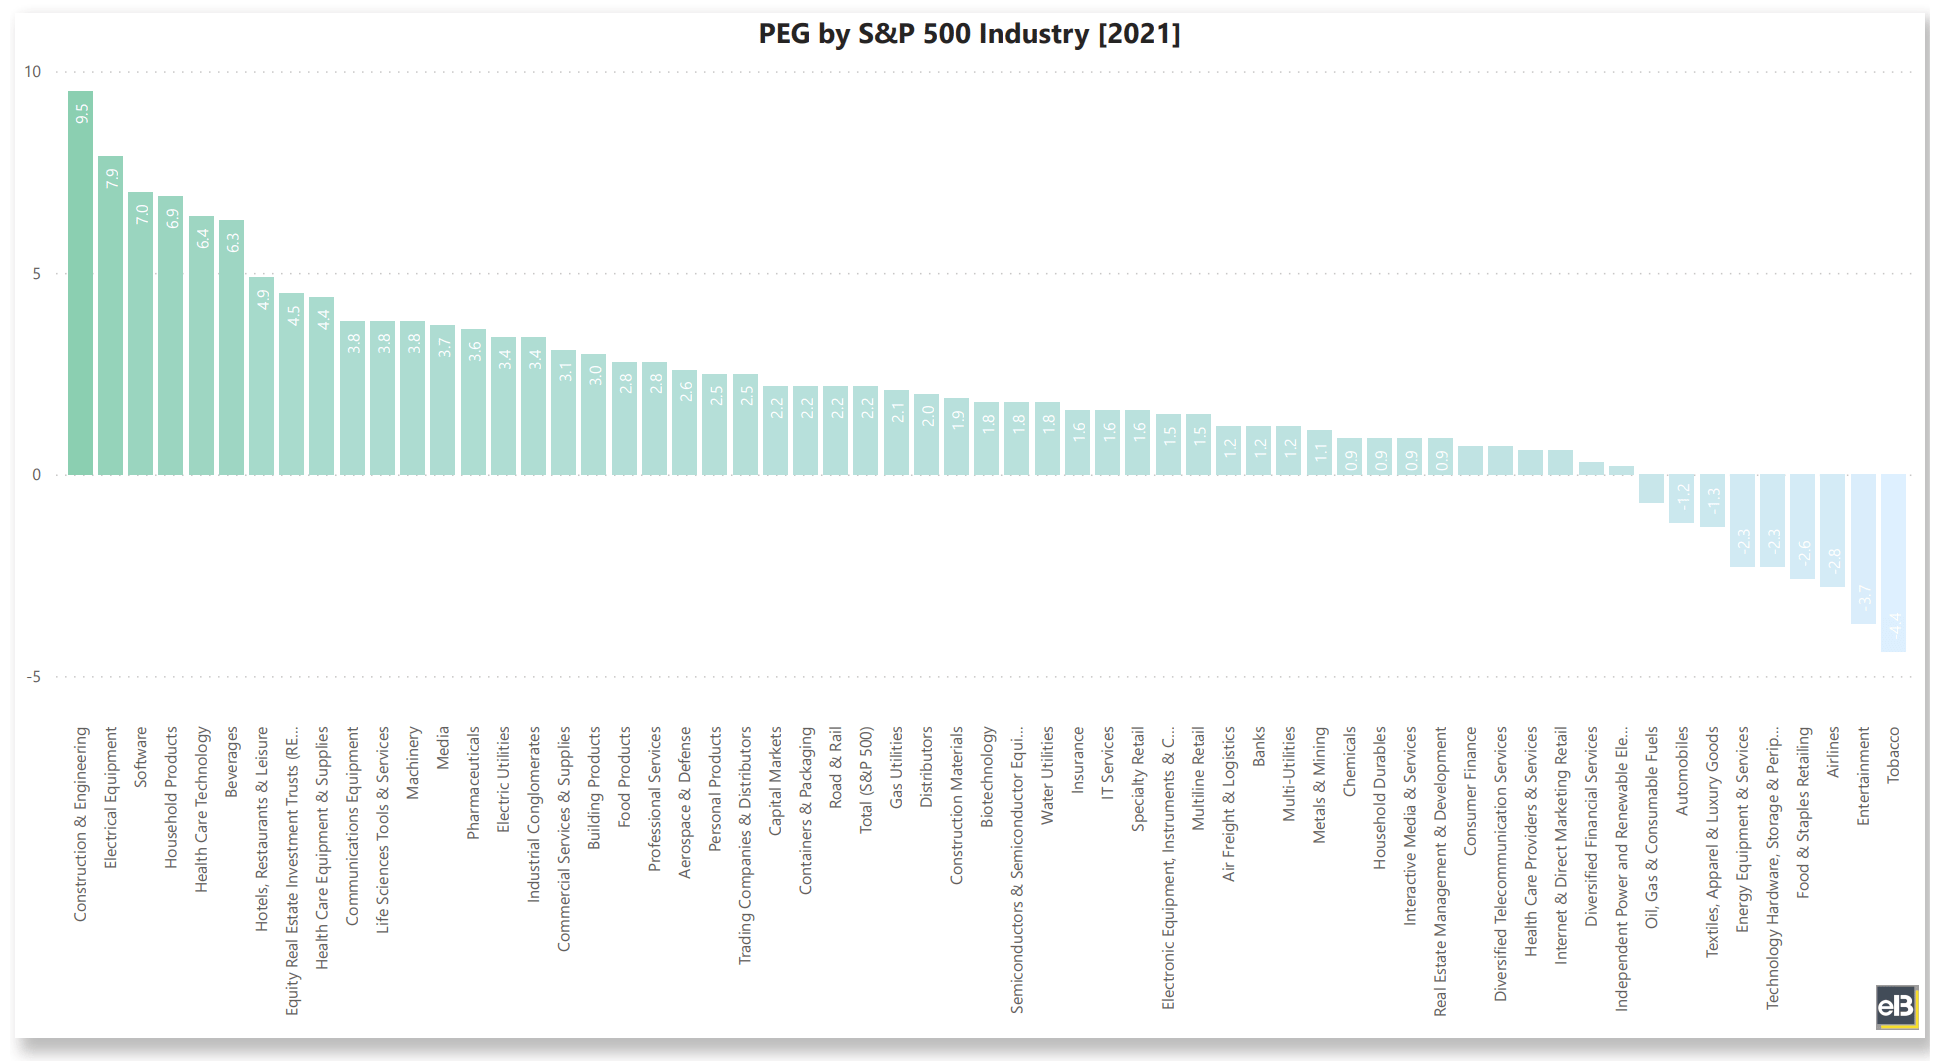
Here’s a breakdown of the average PEG ratio of the S&P 500 by industry:
| S&P 500 Industry | 2021 | 2020 |
| Aerospace & Defense | 2.6 | 2.1 |
| Air Freight & Logistics | 1.2 | 2.6 |
| Airlines | -2.8 | 0.4 |
| Auto Components | 0.3 | |
| Automobiles | -1.2 | -0.3 |
| Banks | 1.2 | 1.1 |
| Beverages | 6.3 | 3.3 |
| Biotechnology | 1.8 | 1.5 |
| Building Products | 3.0 | 1.3 |
| Capital Markets | 2.2 | 0.7 |
| Chemicals | 0.9 | 2.8 |
| Commercial Services & Supplies | 3.1 | 3.1 |
| Communications Equipment | 3.8 | 1.5 |
| Construction & Engineering | 9.5 | 1.6 |
| Construction Materials | 1.9 | 1.3 |
| Consumer Finance | 0.7 | 0.6 |
| Containers & Packaging | 2.2 | 5.9 |
| Distributors | 2.0 | 2.3 |
| Diversified Financial Services | 0.3 | 0.3 |
| Diversified Telecommunication Services | 0.7 | 1.3 |
| Electric Utilities | 3.4 | 2.7 |
| Electrical Equipment | 7.9 | 2.0 |
| Electronic Equipment, Instruments & Components | 1.5 | -1.7 |
| Energy Equipment & Services | -2.3 | |
| Entertainment | -3.7 | 2.1 |
| Equity Real Estate Investment Trusts (REITs) | 1.9 | 3.1 |
| Equity Real Estate Investment Trusts (REITs) | 2.6 | 3.7 |
| Food & Staples Retailing | -2.6 | 2.9 |
| Food Products | 2.8 | 1.8 |
| Gas Utilities | 2.1 | 3.4 |
| Health Care Equipment & Supplies | 4.4 | 2.1 |
| Health Care Providers & Services | 0.6 | 1.8 |
| Health Care Technology | 6.4 | 3.9 |
| Hotels, Restaurants & Leisure | 4.9 | 2.6 |
| Household Durables | 0.9 | 0.2 |
| Household Products | 6.9 | 3.5 |
| Independent Power and Renewable Electricity Producers | 0.2 | -2.8 |
| Industrial Conglomerates | 3.4 | 2.1 |
| Insurance | 1.6 | 2.2 |
| Interactive Media & Services | 0.9 | 1.6 |
| Internet & Direct Marketing Retail | 0.6 | 5.0 |
| IT Services | 1.6 | 2.9 |
| Leisure Products | 5.5 | |
| Life Sciences Tools & Services | 3.8 | 2.2 |
| Machinery | 3.8 | 2.7 |
| Media | 3.7 | 0.9 |
| Metals & Mining | 1.1 | 3.4 |
| Multiline Retail | 1.5 | 1.9 |
| Multi-Utilities | 1.2 | 2.7 |
| Oil, Gas & Consumable Fuels | -0.7 | -0.7 |
| Personal Products | 2.5 | 1.5 |
| Pharmaceuticals | 3.6 | 0.6 |
| Professional Services | 2.8 | 2.1 |
| Real Estate Management & Development | 0.9 | 0.4 |
| Road & Rail | 2.2 | 1.2 |
| Semiconductors & Semiconductor Equipment | 1.8 | 1.7 |
| Software | 7.0 | 3.8 |
| Specialty Retail | 1.6 | 1.3 |
| Technology Hardware, Storage & Peripherals | -2.3 | -0.3 |
| Textiles, Apparel & Luxury Goods | -1.3 | 8.4 |
| Tobacco | -4.4 | 5.1 |
| Trading Companies & Distributors | 2.5 | 1.8 |
| Water Utilities | 1.8 | |
| Wireless Telecommunication Services | 1.3 | |
| Total (S&P 500) | 2.2 | 2.2 |
Source: Company filings and estimates from Sather Research LLC.
Again, this data was pulled from quickfs.net’s premium plugin which pulls from publicly available company filings, and adjusted to ignore high and low numbers that would greatly skew the average, with any values above 20 or below -20 being deleted.
Due to the differing months for fiscal year period reporting schedules with all companies, each year’s figures may not fully represent the actual fiscal year displayed. All values represent current S&P 500 constituents and do not account for previous companies that have been dropped from the index.
The link for a screenshot of the entire 19-year dataset from Fiscal Years 2003 – 2021: Average PEG Ratio of the S&P 500 by Industry.
Supplemental information
Here’s a list of the tickers which were included for this post (current S&P 500 constituents, as of 4/7/2022):
MMM AOS ABT ABBV ABMD ACN ATVI ADM ADBE ADP AAP AES AF A AIG APD AKAM ALK ALB ARE ALGN ALLE LNT ALL GOOGL GOOG MO AMZN AMCR AMD AEE AAL AEP AXP AMT AWK AMP ABC AME AMGN APH ADI ANSS ANTM AON APA AAPL AMAT APTV ANET AIZ T ATO ADSK AZO AVB AVY BKR BLL BAC BBWI BAX BDX WRB BRK.B BBY BIO TECH BIIB BLK BK BA BKNG BWA BXP BSX BMY AVGO BR BRO BF.B CHRW CDNS CZR CPT CPB COF CAH KMX CCL CARR CTLT CAT CBOE CBRE CDW CE CNC CNP CDAY CERN CF CRL SCHW CHTR CVX CMG CB CHD CI CINF CTAS CSCO C CFG CTXS CLX CME CMS KO CTSH CL CMCSA CMA CAG COP ED STZ CEG COO CPRT GLW CTVA COST CTRA CCI CSX CMI CVS DHI DHR DRI DVA DE DAL XRAY DVN DXCM FANG DLR DFS DISCA DISCK DISH DIS DG DLTR D DPZ DOV DOW DTE DUK DRE DD DXC EMN ETN EBAY ECL EIX EW EA EMR ENPH ETR EOG EPAM EFX EQIX EQR ESS EL ETSY RE EVRG ES EXC EXPE EXPD EXR XOM FFIV FDS FAST FRT FDX FITB FRC FE FIS FISV FLT FMC F FTNT FTV FBHS FOXA FOX BEN FCX AJG GRMN IT GE GNRC GD GIS GPC GILD GL GPN GM GS GWW HAL HIG HAS HCA PEAK HSIC HSY HES HPE HLT HOLX HD HON HRL HST HWM HPQ HUM HII HBAN IEX IDXX ITW ILMN INCY IR INTC ICE IBM IP IPG IFF INTU ISRG IVZ IPGP IQV IRM JBHT JKHY J JNJ JCI JPM JNPR K KEY KEYS KMB KIM KMI KLAC KHC KR LHX LH LRCX LW LVS LDOS LEN LLY LNC LIN LYV LKQ LMT L LOW LUMN LYB MTB MRO MPC MKTX MAR MMC MLM MAS MA MTCH MKC MCD MCK MDT MRK FB MET MTD MGM MCHP MU MSFT MAA MRNA MHK MOH TAP MDLZ MPWR MNST MCO MS MOS MSI MSCI NDAQ NTAP NFLX NWL NEM NWSA NWS NEE NLSN NKE NI NDSN NSC NTRS NOC NLOK NCLH NRG NUE NVDA NVR NXPI ORLY OXY ODFL OMC OKE ORCL OGN OTIS PCAR PKG PARA PH PAYX PAYC PYPL PENN PNR PEP PKI PFE PM PSX PNW PXD PNC POOL PPG PPL PFG PG PGR PLD PRU PEG PTC PSA PHM PVH QRVO PWR QCOM DGX RL RJF RTX O REG REGN RF RSG RMD RHI ROK ROL ROP ROST RCL SPGI CRM SBAC SLB STX SEE SRE NOW SHW SBNY SPG SWKS SJM SNA SEDG SO LUV SWK SBUX STT STE SYK SIVB SYF SNPS SYY TMUS TROW TTWO TPR TGT TEL TDY TFX TER TSLA TXN TXT TMO TJX TSCO TT TDG TRV TRMB TFC TWTR TYL TSN USB UDR ULTA UAA UA UNP UAL UNH UPS URI UHS VLO VTR VRSN VRSK VZ VRTX VFC VTRS V VNO VMC WAB WMT WBA WM WAT WEC WFC WELL WST WDC WRK WY WHR WMB WTW WYNN XEL XYL YUM ZBRA ZBH ZION ZTS

Andrew Sather
Andrew has always believed that average investors have so much potential to build wealth, through the power of patience, a long-term mindset, and compound interest.
