Financial statements can look intimidating. There can be many line items. To learn how to navigate a company’s balance sheet and income statement– break it up into sections.
In this post, we will chop the financial statements for Apple ($AAPL) into key sections, so you can better understand and learn what’s most important.
To start– let’s talk about why the balance sheet and income statement are important. Particularly, what they are there to communicate to investors.
Balance Sheet vs Income Statement Basics
The easiest way I can describe each statement is by relating them to your personal finances.
If any of you like to track your net worth, with debts and assets (like your house), then that is exactly like a company’s balance sheet.
A balance sheet for a major corporation might have certain assets that are specific to running a business. Examples include inventory or accounts receivables (sales that are made but haven’t turned into cash yet).
At its core, a balance sheet tells you what a company’s net worth is.
The income statement is very similar to the paycheck you receive from your job. At the very top is your gross income, and this is like a company’s revenue. Then taxes are taken out, to arrive at your take home pay, which is your net income.
Like an individual person has, a corporation has a net income figure that is calculated after taxes, but it also includes the expenses it takes to run a business. Examples include the cost to have employees and the costs of buying parts to create inventory.
Like with a person, we can tell the general financial condition of the entity simply by looking at the balance sheet and income statement.
$AAPL’s Balance Sheet: Key Metrics
Let’s take a look at Apple’s latest annual report (10-K). We will focus on the consolidated balance sheets and income statement.
When it comes to a balance sheet, the most important metrics are really the most common sense. We should care very much about Total Assets, Total Liabilities, and Shareholder’s Equity.
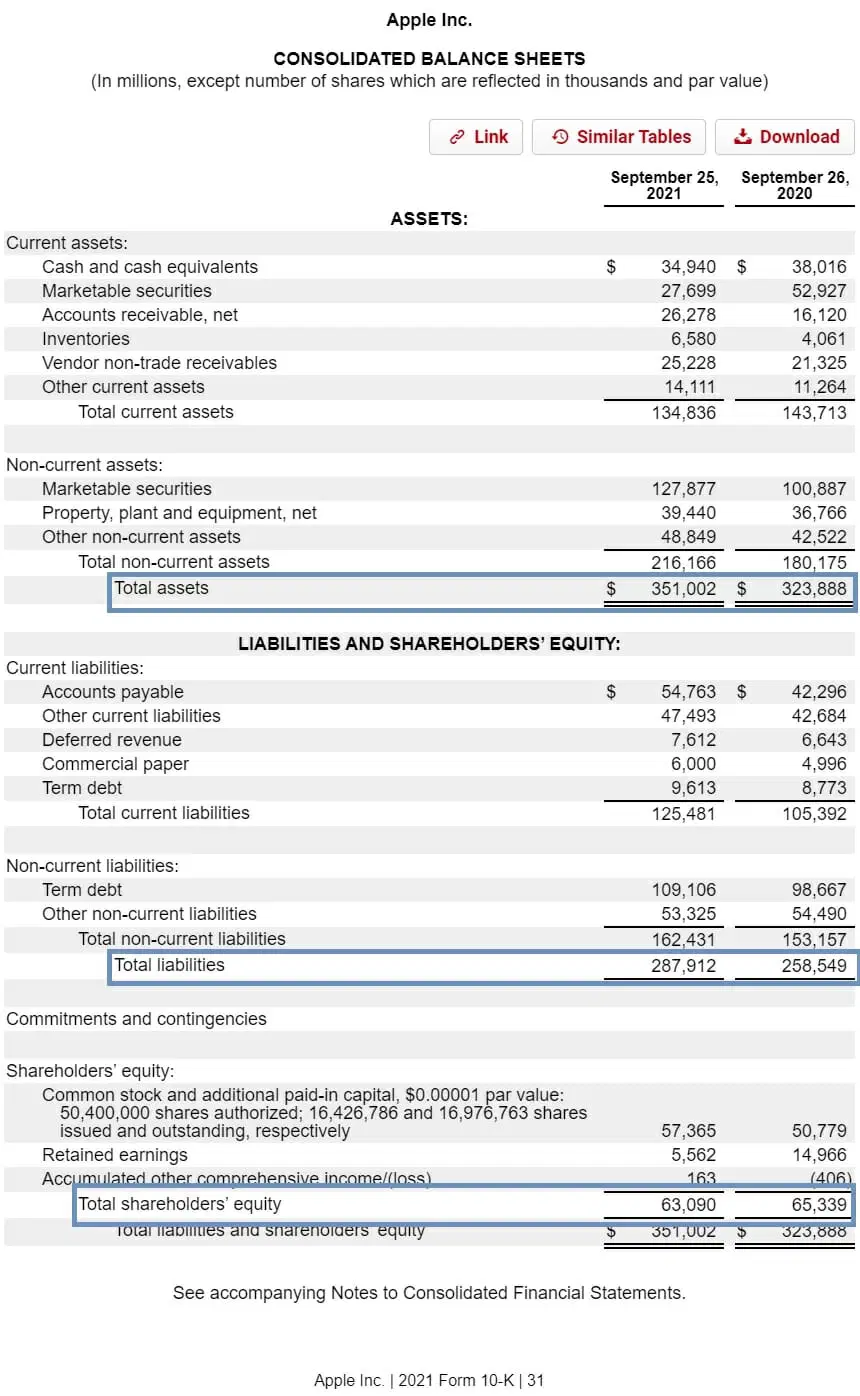
Shareholder’s Equity is simply Total Assets minus Total Liabilities. You can think about that as a company’s net worth, and that figure is also referred to as Book Value in the Wall Street world.
Total Assets are exactly what they sound like. It’s what a company owns. You make income streams from assets, so the more assets a company has (in general), the more profitability they are likely to have.
Total Liabilities is what a company owes. This is very important and very overlooked.
In general, be careful when making exceptions for companies with high Total Liabilities. These are expenses that a company has to pay no matter what. Assets can be sold to create cash, they can fluctuate; but liabilities will always eventually be due, and you can’t escape that fact.
Two More Balance Sheet Metrics
To see how healthy a company is in the short term (its “liquidity”), you can look at two metrics:
- Current Assets
- Current Liabilities
These are pretty simple. They are tangible assets/liabilities that we can also relate to personal finances.

When a business struggles and funding dries up, companies without much liquidity can find themselves in big trouble– even bankrupt.
You can use simple ratios such as the quick ratio and current ratio to look inside a company’s short term assets and liabilities and determine how safe (or not) they are.
$AAPL’s Income Statement: Key Metrics
Now let’s look at the Income Statement for $AAPL.
Like the balance sheet, with just a few figures we can get a sense of a company’s profitability. (Remember, it’s profitability for the income statement, and long term health for the balance sheet).
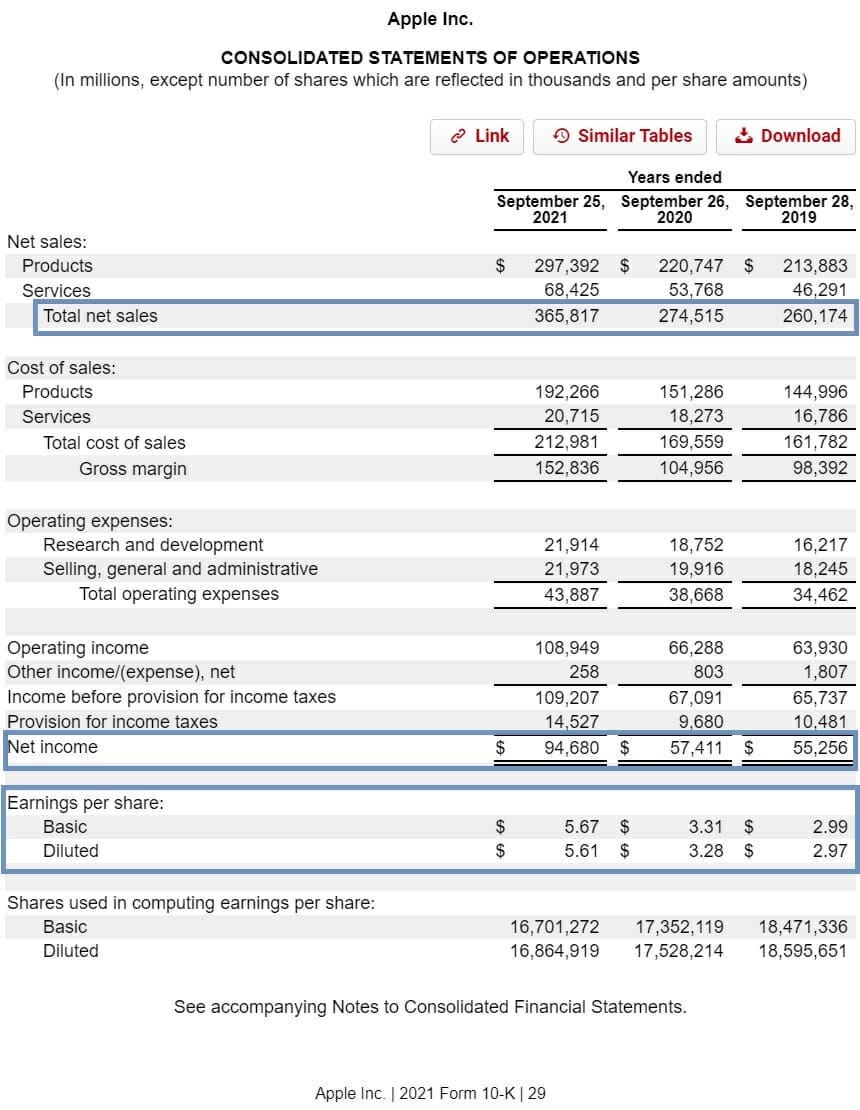
Revenue, or Sales, will be the figure right at the top of the income statement. It tells us how much a company brings in before expenses or taxes are taken out.
You might hear analysts or other business people talk about “growing the top line”; the top line refers to the revenue or sales figure precisely because it is the top line on an income statement.
What revenue or sales can tell us about a business is how much demand a company has for its products or services. This figure tends to be a lot less volatile than the earnings, which we’ll talk about next.
Net Income, or Earnings, tells you exactly how much profit a company made in a given year.
This is the final number after a company has paid all of its expenses, taxes, and had other non-cash adjustments (such as depreciation or amortization). Don’t worry about learning all those details now, just the basic concepts.
At its most basic form, Earnings is where a company will fuel their business growth from, and so obviously more is better.
The final figure to consider is the EPS or Earnings Per Share. This is the Net Income number divided by the Shares Outstanding.
All this does is tell you, as the shareholder, how much of the earnings you receive per share you purchase.
Like with Net Income, more is better, and you can compare the EPS from year to year to see how much growth the company has had lately. Earnings growth tends to correlate with a stock’s Share Price growth over the very long term, and is a main source of gains.
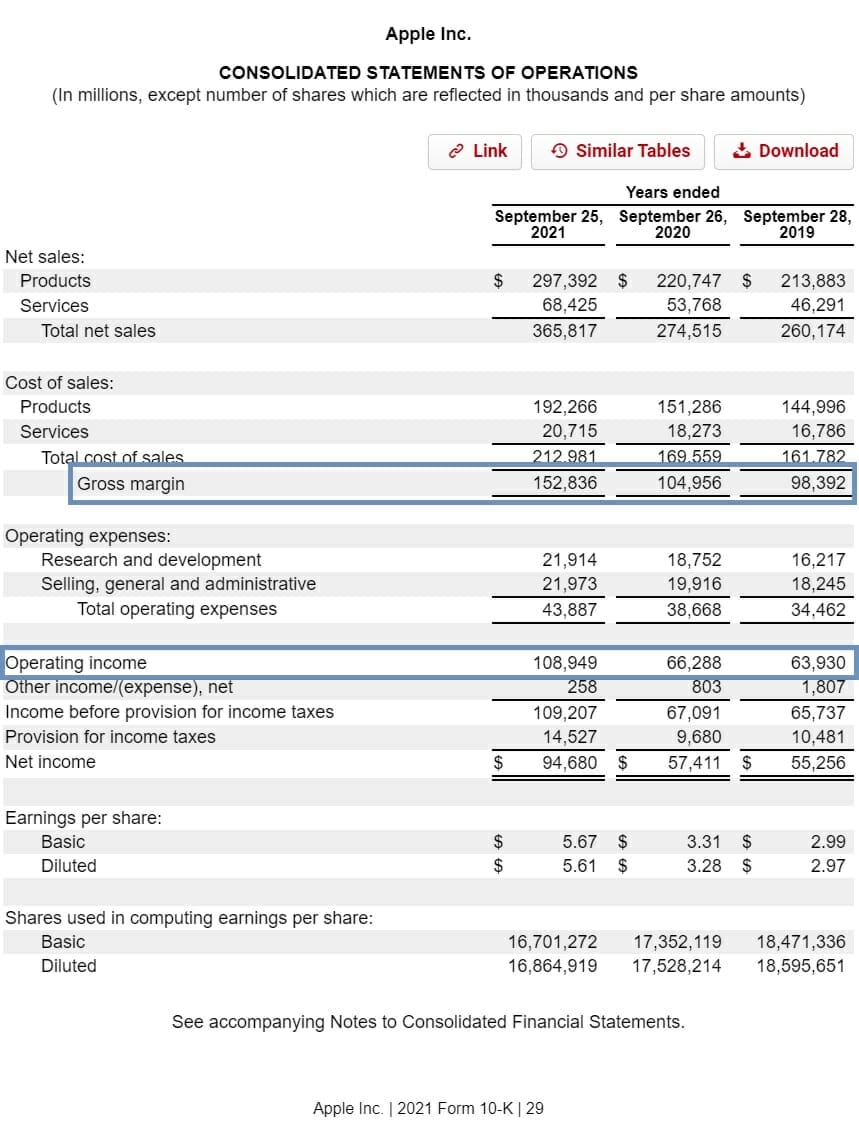
Two More Income Statement Metrics
To get a better sense of the main drivers of profitability (Net Income) for a company, you can look at two metrics:
- Gross Profit (or “Gross Margin”)
- Operating Profit (or “Operating Income”)
These segment the different costs needed to run a business. For Gross Profit, the main costs to create a product or service are deducted. For Operating Profit, other operating expenses are deducted such as marketing (“SG&A”) and research and development (“R&D”).
You can really get into the weeds with these concepts. They are very important, and Wall Street examines them closely. But like eating a pizza, you don’t have to do it all at once.
Take your time digesting these, and look to our other in-depth guides about profitability metrics, income statements (line-by-line breakdown), and balance sheets (line-by-line breakdown) to get a better sense for the key drivers of a business.

Andrew Sather
Andrew has always believed that average investors have so much potential to build wealth, through the power of patience, a long-term mindset, and compound interest.
