Earnings manipulations are one of the more sinister aspects of financial accounting. While it isn’t prevalent, it is an aspect of investing to be aware and protect ourselves, if possible. The Beneish M-Score is a formula we can easily calculate that allows us to determine the likelihood of earnings fraud.
The Beneish M-Score correctly predicted the fraud that Enron was committing, but unfortunately, no one on Wall Street was listening. The formula includes eight variables to help us determine manipulation.
In today’s post, we will cover:
- What is the Beneish M-Score?
- Understanding the Elements of the Beneish M-Score
- Real-Life Examples of the Beneish M-Score In Action
Ok, without further ado, let’s dive in.
What is the Beneish M-Score?
According to Investopedia:
“The Beneish model is a mathematical model that uses financial ratios and eight variables to identify whether a company has manipulated its earnings. It is used as a tool to uncover financial fraud.
The variables are constructed from the data in the company’s financial statements, and once calculated, create an M-Score to describe the degree to which the earnings have been manipulated.”
The formula was first introduced by Professor M. Daniel Beneish of the Kelley School of Business from Indiana University in 1999. He published the paper “The Detection of Earnings Manipulations.”
The model that Beneish created is a mathematical model based on financial ratios and eight variables that attempts to identify whether a company has manipulated earnings.
We use elements from each of the three main financial statements to plug into the Benish M-Score model to illustrate how much the earnings have been manipulated.
He created the model as a tool to uncover financial fraud, and a group of students at Cornell University used the model to predict that Enron was manipulating earnings, which, as I mentioned previously, Wall Street ignored.
Earnings manipulations are rare these days, but having a tool like the Beneish M-Score is a great idea to run as your screen through different investing opportunities.
Let’s learn how the model is set up and the inputs required.
Understanding the Beneish Model
The basic idea behind the model is that companies are more likely to manipulate their profits if they are showing declining gross margins, operating expenses, and leverage both rising, along with significant revenue growth.
These are the figures he revealed that might cause earnings manipulation through various of these means.
The model uses different financial ratios that are weighted and include eight different variables.
The Beneish eight variables are:
- DSRI: Day’s sales in a receivable index
- GSI: Gross margin index
- AQI: Asset quality index
- SGI: Sales growth index
- DEPI: Depreciation index
- SGAI: Sales and general and administrative expenses index
- LVGI: Leverage index
- TATA: Total accruals to total assets
We will explore all of these ratios and their inputs in the next section.
Once these ratios are calculated for each variable, they are then weighted in the formula and, once calculated, give us an M-Score for the company.
The M-Score moves on a range of results, with an M-Score of less -2.22 indicating the company is not manipulating earnings. And an M-Score of above -2.22 indicates that a company is likely manipulating earnings to some extent.
The Beneish M-Score model is as follows:
M = -4.84 + 0.92*DSRI + 0.528*GMI + 0.404*AQI + 0.892*SGI – 0.172*SGAI + 4.679*TATA – 0.327*LVGI
Ok, I know that looks like a mouthful, but once we calculate our ratios for each acronym, it is will be a matter of adding, subtracting, and multiplying, which I know you can all accomplish.
As mentioned before, we gather information from the financials and calculate our formulas; the information is gathered from all three financials.
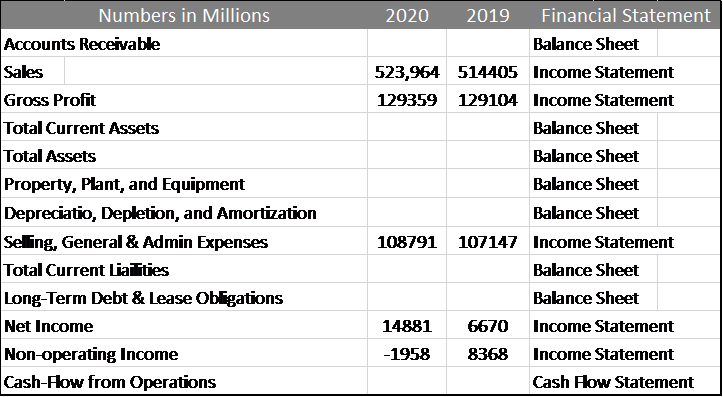
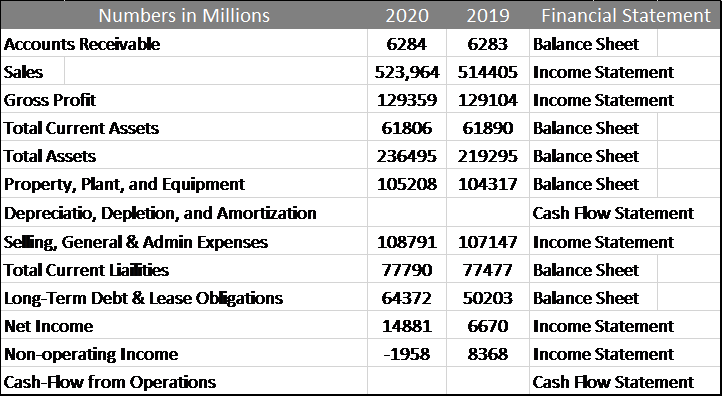
Here is the list of the items we need to calculate the Beneish M-Score:
- Accounts Receivable
- Revenue
- Gross Profit
- Total Current Assets
- Total Assets
- Property, Plant, and Equipment
- Depreciation, Depletion, and Amortization
- Selling, General & Admin Expense
- Total Current Liabilities
- Long-Term Debt & Capital Lease Obligations
- Net Income
- Non-operating Income
- Cash Flow from Operations
Don’t worry; I will layout where we find all of these in the financial statements.
Ok, now we have seen the formula and inputs, let’s start to put this into practice.
Real-Life Examples of the Beneish M-Score In Action
The first company I would like to analyze for earnings manipulations is Walmart (WMT). Walmart, the retail company with a market cap of $350.93B, and a market price of $123.84.
Keep in mind that this formula is not a valuation technique; it is used solely to determine earnings manipulations.
The first step is to gather all the data from the above charts from the financials.
Our first financial we will look at will be the income statement for Walmart, and all numbers listed will be in millions unless otherwise stated. And we will be analyzing the years 2020 and 2019; it is recommended that you use twelve-month numbers for this model. It can be TTM if you wish, but I am going to use the 10-ks to make finding the information more realistic.
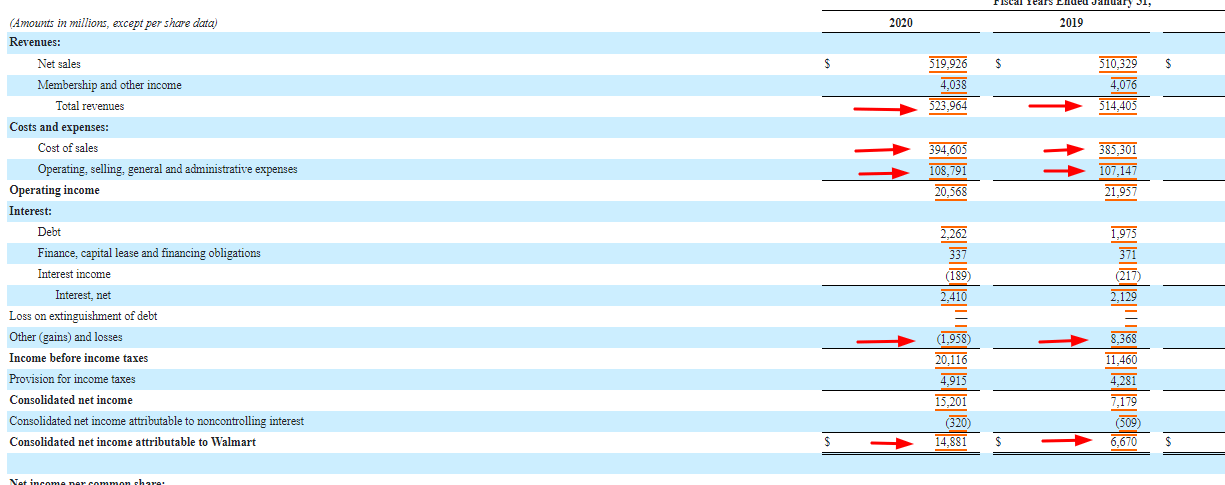
Click to zoomItems to pull from the income statement:
One comment on the numbers above, the gross profit is not listed directly on the 10-k, to calculate the gross profit, we subtract the cost of sales from the revenues to achieve our number.
For example, the revenues for Walmart in 2020 was $523,964, and the cost of sales was $394,605. That is why I marked the cost of sales as a number to note for our calculations.
Plugin the numbers:
Gross Sales = Total Revenues – Cost of Sales
Gross Sales = $523,964 – $394,605
Gross Sales = $129,359
Ok, now we will look at the balance sheet to gather our next round of numbers.
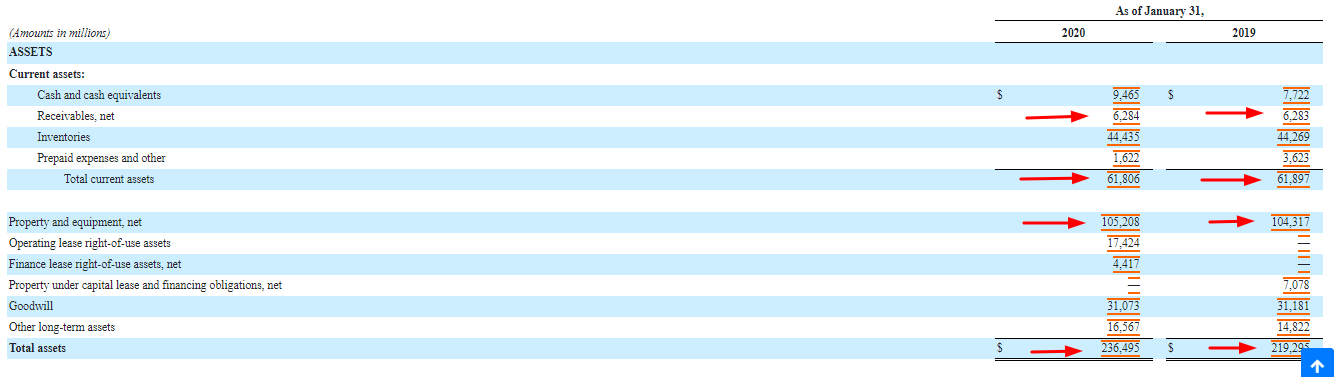
Here is the updated chart with additional numbers added in:
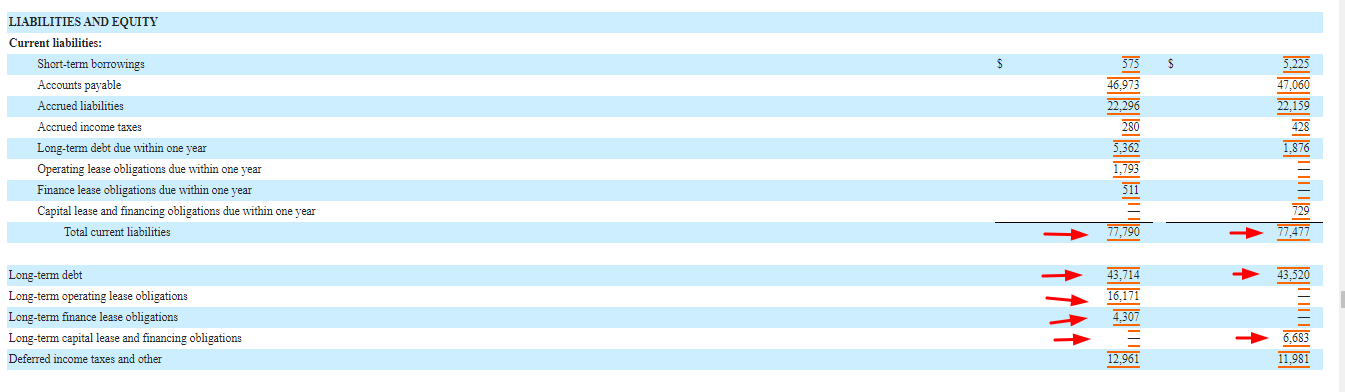
A note to the long-term debt and lease obligations, again, Walmart doesn’t add them all up, so I added the above-highlighted items to find the final number.
Next, we can move on to the cash flow statement for our last two numbers.
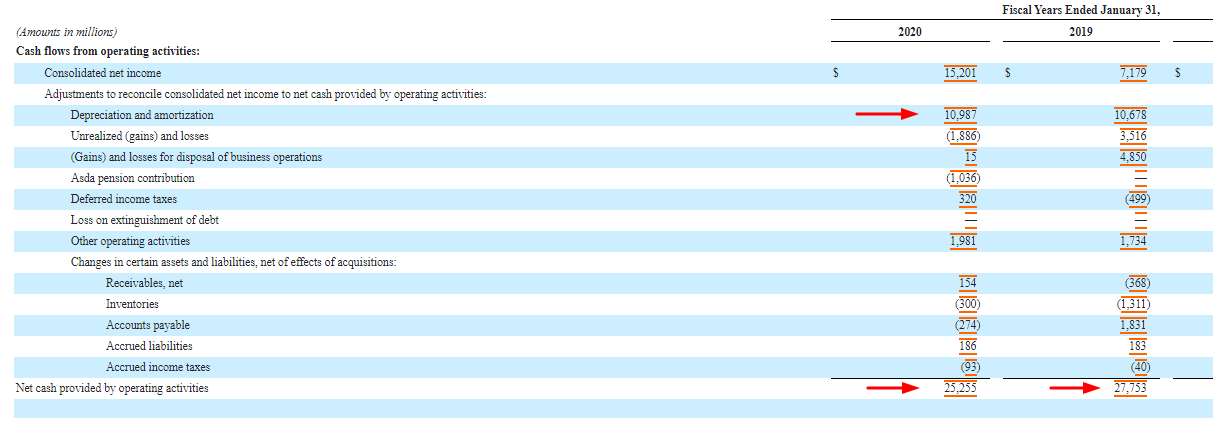
I am adding in the numbers from our cash flow statement.
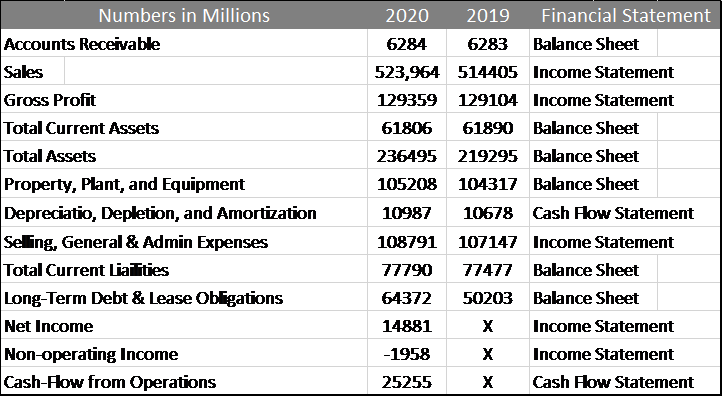
That completes our diving into the financial statements; now, we can begin our process of calculating the financial ratios. A note before we continue, the last three items listed on the chart above are only for the current year; there is no comparison needed.
Next, we will start to calculate our eight ratios, and then we can plug those results into our formula.
- DSRI = Day Sales in Receivables Index
It is measured as the ratio of revenue in accounts receivable in year one versus year two. A big increase in DSRI could be indicative of revenue inflation.
DSRI = ( Receivables 2020 / Revenue 2020 ) / ( Receivables 2019 / Revenue 2019 )
We are pulling the numbers from above.
DSRI = ( $6,284 / $523,964 ) / ( $6,283 / $514,405)
DSRI = 0.01199319 / 0.01221411
DSRI = 0.9819
- GMI = Gross Margin Index
It is measured as the ratio of gross margin of 2019 versus a gross margin of 2020. Gross margins have deteriorated when this index is above one, for example.
GMI = ( Gross Profit 2019 / Revenue 2019 ) / ( Gross Profit 2020 / Revenue 2020 )
GMI = ( $121,904 / $514,405 ) / ( $129,359 / $523,964 )
GMI = 0.25097734 / 0.24688528
GMI = 1.0166
- AQI = Asset Quality Index
AQI is the ratio of asset quality of 2020 versus 2019. The asset quality is measured as the ratio of non-current assets other than property, plant, and equipment (PPE) in relation to total assets.
AQI = ( 1 – ( Current Assets 2020 + PPE 2020 ) / Total Assets 2020 ) / ( 1 – ( Current Assets 2019 + PPE 2019 ) / Total Assets 2019 )
AQI = ( 1 – ( $61,806 + $105,208 ) $236,495 ) / ( 1 – ( $61,890 + $104,317) / $219,295 )
AQI = ( 1 – ( $167,014 / $236,495 ) / ( 1 – ( $166,207 / $219,295 )
AQI = ( 1 – 0.7066 ) / ( 1 – 0.7592 )
AQI = 0.2934 / 0.2408
AQI = 1.22
- SGI = Sales Growth Index
A ratio that is comparing sales from 2020 to 2019, sales itself cannot be a measurement of manipulation. Still, growth companies can feel pressure to keep up appearances and may find ways to manipulate. It included changing how they recognize revenue, and when it is recognized.
SGI = Revenue 2020 / Revenue 2019
SGI = $523,964 / $514,405
SGI = 1.0186
- DEPI = Depreciation Index
DEPI is measured as the ratio of the rate of depreciation in 2020 versus 2019. A DEPI of greater than one indicates that assets are depreciating at a slower rate.
DEPI = ( Depreciation 2019 / ( Depreciation 2019 + PPE 2019 ) ) / ( Depreciation 2020 / ( Depreciation 2020 + PPE 2020 ))
DEPI = ( $10678 / ( $10,678 + $104,317 )) / ( $10,987 / ( $10,987 + $105,208 ))
DEPI = ( $10,678 / $114,995 ) / ( $10,987 / $116,195 )
DEPI = 0.09285 / 0.09455
DEPI = 0.9820
- SGAI = Sales, General and Administrative Index
The ratio of SGAI in 2020 versus 2019, with SGAI greater than one indicating that the company is getting less efficient in generating sales.
SGAI = ( SGA 2020 / Sales 2020 ) / ( SGA 2019 / Sales 2019 )
SGAI = ( $108,791 / $523,964 ) / ( $107,147 / $514,405 )
SGAI = 0.2076 / 0.2082
SGAI = 0.9968
- LVGI = Leverage Index
The LVGI is the ratio of total debt compared to total assets in the years 2020 versus 2019. An LVGI greater than one indicates an increase in leverage.
LVGI = ( ( LTD 2020 + Current Liabilities 2020 ) / Total Assets 2020 ) / ( ( LTD 2019 + Current Liabilities 2019 ) / Total Assets 2019 )
LVGI = (( $64,372 + $77,790) / $236,495 ) / (($50,203+$77,477) / $219,295)
LVGI = ( $142,162 / $236,495 ) / ( $127,680 / $219,295 )
LVGI = 0.6011 / 0.5822
LVGI = 1.03
- TATA = Total Accruals to Total Assets
TATA = ( Net Income – Non-operating Income – Cash Flow from Operations ) / Total Assets
TATA = ( $14,881 – $1,958 – $25,255 ) / $236,495
TATA = -0.0521
Phew, we made it, we have calculated all of our ratios to know to calculate the Beneish M-Score for Walmart.
A refresher on the formula.
M = -4.84 + 0.92*DSRI + 0.528*GMI + 0.404*AQI + 0.892*SGI – 0.172*SGAI + 4.679*TATA – 0.327*LVGI
And our numbers from our ratio calculations:
- DSRI = 0.9891
- GMI = 1.1066
- AQI = 1.22
- SGI = 1.0186
- DEPI = 0.9820
- SGAI = 0.9968
- LVGI = 1.03
- TATA = -0.0521
Ok, now that we have all of our numbers gathered, let’s plug them into the formula.
M = -4.84 + 0.92*0.9891 + 0.528*1.1066 + 0.404*1.22 + 0.892*1.0186 – 0.172*0.9968 + 4.679*-0.0521 – 0.327*1.03
M = -2.610
Wasn’t that fun? It does take a bit to gather the numbers and calculate the formula, but once you have all the data, it is relatively easy.
So what does the above scale tells us?
What the Beneish M-Score Tells Us?
To help us determine the likelihood of earnings manipulations, Beneish created a scale. The higher you go on the scale, the more likely you are manipulating earnings.
For example, here is a scale representation of the results and how a company would fare.
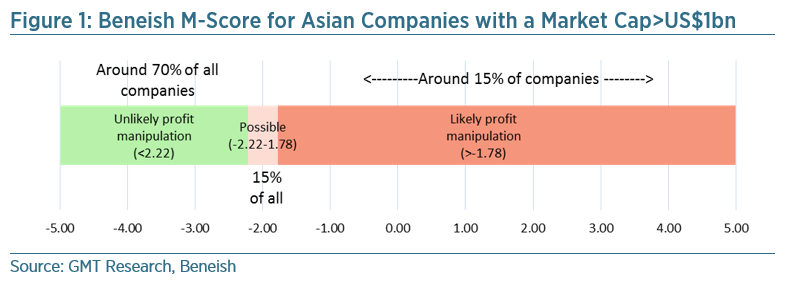
As we can see from the scale above, Walmart, with its score of -2.61, would not be considered an earnings manipulator.
Here is a list of some of the companies from the S&P 500 and their Beneish M-Scores:
- Berkshire Hathaway (BRK.B) -3.85
- Facebook (FB) -3.04
- Apple (AAPL) -2.82
- Tesla (TSLA) -2.65
- Verizon (VZ) -2.77
- Boeing (BA) 18.46
- McDonalds (MCD) -2.86
- Nike (NKE) -2.54
As we can see, with 99% of the companies we scanned, they are all doing well in regards to possible earnings manipulations, except for Boeing. After that little scan, it would bear looking further into what is going on with Boeing before deciding to buy any shares.
If the above formulas and ratios seem a little daunting to you, there is a fantastic website that has a calculator for you. You simply add the numbers from the financials, and it will calculate everything for you.
You can find it here.
I highly recommend you either calculate these ratios yourself or use the calculator online for one main reason. The more you can get comfortable with the financials of a company and how all the parts fit together, the quicker you will understand any business. You can cheat if you like and find the scores on any financial website, but you can gain valuable knowledge by going to the source directly.
Like any skill, it just takes a little repetition to become a master.
Final Thoughts
In this day and age of technology, there is little room for fraud and earnings manipulation. But it doesn’t mean it doesn’t happen, and using the Beneish M-Score as one of your screening tools is extremely beneficial. I have added it to my list of questions I ask before buying any company.
Typically I would determine the score before I dig too deeply into researching the company as if they are manipulating earnings. They are not worth my time, and I can move on to another opportunity.
The Beneish M-Score is used by analysts and hedge funds to screen for stocks, as it is an all-encompassing tool that looks at many different aspects of the company to determine if the company is reporting their financials on the up and up.
Earnings manipulations can occur, but they are rare, especially in the US. Mainly because of the auditing that is done and the adherence to GAAP accounting. Another reason I like to focus on the 10-ks is they are audited, where the quarterly reports are not, so you will find a lot of non-GAAP numbers that can skew the results.
Well, that is going to wrap up today’s discussion. I hope you enjoyed the post, and you found something useful for your investing journey.
If you have any questions, please don’t hesitate to reach out.
Until next time.
Take care and be safe out there,
Dave
