Berkshire Hathaway reported its first-quarter earnings on May 2, 2020. This report is a summary of those first-quarter results and will not attempt any analysis of those results, rather a broad overview of the financial results of Berkshire Hathaway. If you would like more detailed information, please follow the link below:
Berkshire Hathaway 10Q First Quarter 2020
Sample of Financial Data and Ratios from the 1Q of 2020:
- Market Cap – $473.07 Billion
- Current Market Price – $182.83
- Enterprise Value – $537.95 Billion
- Earnings Per Share – -$20.44
- Return on Equity – -49.97%
- Return on Assets – -25.22%
- Return on Invested Capital – -28.23
- Debt to Equity – 0.28%
Summary of First Quarter Results
Berkshire organizes their operating businesses of insurance, manufacturing, service, and retail businesses in reportable business segments. Certain businesses are grouped for a segment reporting basis, depending on shared products or services. All financials are reported as follows:
Revenues of Operating Business 2020 2019
Insurance:
Underwriting
GEICO $9,109 $8,622
Berkshire Hathaway Primary 2,369 2,151
Berkshire Hathaway Reinsurance 4,270 3,546
Investement Income 1,648 1,487
Total Insurance 17,396 15,806
BNSF 5,417 5,762
Berkshire Hathaway Energy Group 4,507 4,672
Manufacturing 15,305 15,070
McLane Company 11,821 12,199
Service and Retailing 61,132 60,534
Total 61,256 60,678
Reporting earnings before income taxes for the first quarter of 2020, comparing to the first quarter of 2019 is as follows:
EBIT 2020 2019
Insurance:
Underwriting
GEICO $984 $770
Berkshire Hathaway Primary (33) (30)
Berkshire Hathaway Reinsurance (489) (253)
Investement Income 1,647 1,485
Total Insurance 2,109 2,194
BNSF 1,584 1,665
Berkshire Hathaway Energy Group 419 540
Manufacturing 2,111 2,194
McLane Company 65 111
Service and Retailing 558 621
Total 6,846 7,103
Reconciliation of segments to consolidated amount:
Investment and derivative gains(losses) (70,275) 20,322
Interest Expense (136) (109)
Equity Method Investments 300 168
Corporate, eliminations and others 216 163
Total EBIT (63,049) 27,647
Net earnings and losses for the first quarter of 2020 as follows:
- Insurance Underwriting – $363
- Insurance Investment Income – 1,386
- Railroad – 1,190
- Utilities and Energy – 561
- Manufacturing, servicing and retailing – 2,038
- Investment and derivative gains (losses) – (55,617)
- Other – 333
Total earnings attributable to Berkshire in the first quarter of 2020 were $(49,746) compared to $21,661 of the first quarter of 2019.
Insurance – Underwriting
Berkshire views their insurance segment in two different buckets, underwriting and investing. We will discuss the underwriting first, starting with GEICO.
GEICO
GEICO reported first-quarter premiums written of $9,861 million, an increase of 4.32% over the prior-year quarter, with the pretax underwriting earnings of $984 million, a rise over the $770 million reported the prior-year quarter.
The premium increases were primarily a result of voluntary auto policy growth of 6.5% over the past twelve months, which were partially offset by a decrease in average premiums per auto policy due to coverage changes. Voluntary car policies increased by about 380,000 during the first quarter of 2020.
Berkshire’s losses and loss adjustment expenses in the first quarter of 2020 increased $210 million (3.2%) when compared to the prior year 2019. GEICO observed a decrease in the ratio of losses and loss-adjustment expenses to earnings in the first quarter of 2020, which was 74.3%, a decrease of 1.8 % from the prior-year quarter of 2019, which reflected declines in claims frequencies and increases in claims severities.
GEICO claim frequencies in the first quarter were lower:
- Property damage and collision coverage – 12 to 14%
- Personal injury – 9 to 11 %
- Bodily injury coverage – 6 to 8%
Berkshire attributed the declines to lower driving as a result of shelter in place actions taken as a result of Covid-19.
GEICO’s average claims severities in the first quarter were higher:
- Property damage and collision – 7 to 9% range
- Bodily injury – 4 to 6% range
Berkshire reported GEICO underwriting expenses in the first quarter of $1.4 billion, an increase of $63 million, or 4.9% over the prior-year quarter of 2019. In 2019 GEICO’s reported an underwriting expense to premiums earned ratio in the first quarter of 14.9%, which was a decrease compared to 15.0%. The underwriting expense increase was primarily attributable to higher employee-related costs and increased allowances for uncollectible premiums.
Berkshire Hathaway Primary Group
Premiums written and earned for the Group in the first quarter of 2020 were up 4.9% and 10.1%, respectively, compared to prior quarters in 2019. The increase in premiums written showed increases from B.H. Specialty, GUARD, and MedPro Group, all of which were offset partly by decreases from NICO Primary and BHHG. Workers compensation claims declined in the first quarter of 2020, reflecting:
- Overall effects of increases in the market price competition
- Effects of the pandemic lowering insured payroll levels
- and in October 2019, the divestiture of Applied Underwriters.
B.H. Primary generated a pre-tax underwriting loss of $33 million in the first quarter of 2020, compared to $30 million in the prior-year quarter of 2019. The underwriting results were partially a result of claim cost estimates and losses attributed to the pandemic, all of which were offset by lower other underwriting expenses.
B.H. Primary underwriters wrote significant levels of commercial, professional, and workers comp insurance in the first quarter of 2020.
Berkshire Hathaway Reinsurance Group
The Reinsurance Group increased property/casualty premiums that were written in the quarter by 14.5% ($514 million), compared to the increases of 2019 the same quarter of 17.3% or $401 million. The increase in premiums written was a direct result of new business, which included $525 million from a property quota-share contract that became effective in 2020. A decrease offset all of this in foreign currency exchange rates as a result of a strong U.S. dollar.
Loss and loss adjustment expenses for the property/casualty segment increased in the first quarter of 2020 by $346 million or 19.5% over 2019. The increase was attributed to Covid-19 related claims to the tune of $230 million.
Life/health premiums earned totaled $1.4 billion in 2020, an increase of 31.8%, or $327 million compared to 2019. The increase was a direct result of $168 million from a reinsurance contract covering health insurance risks that began in the 4th quarter of 2019.
The life/health insurance business generated pretax underwriting losses of $229 million in the first quarter, compared to earnings of $280 million in the same quarter in 2019. Berkshire incurred pretax losses totaling $234 million in the first quarter as a result of a run-off of variable annuity guarantee reinsurance contracts, which compared to pretax earnings of $89 million in the same quarter of 2019.
Investment Income
Interest and other investment income decreased by 21.9% or $109 million in 2020, which was due to lower income from short-term investments. Dividend income increased in the first quarter of $271 million or 27.9%in the first quarter compared to 2019.
The increase was a direct result of the investment of $10 billion liquidation value of 8% cumulative preferred stock in Occidental, and other higher dividend rates from other stocks in the portfolio.
Berkshire continues to hold large balances of cash, cash equivalents, and short-term U.S Treasuries.
Berkshire reported approximate float levels of $131 billion at quarter-end, up from $129 billion at fourth quarters end in 2019. And the reported cost of the float was negative in both fourth of 2019 and the first quarter of 2020.
Railroad (BNSF)
BNSF saw a decrease in revenue of $345 million or 6% for the first quarter; the total revenues reached $5.4 billion in the first quarter. The revenues reflected a 5.2% decrease in volume and a 0.6% decrease in average revenue by car/unit comparatively. Volume in the quarter was 2.34 million cars/unit, down from 2.46 million cars/units in 2019.
Pre-tax earnings decreased to $1.6 billion, a 4.9% decrease compared to the year-ago quarter, which Berkshire attributed directly to Covid-19 and its impacts.
Revenues from consumer products decreased by 11.8% to $1.8 billion in the first quarter, which reflected lower volumes per car and lower average revenues per car as well. And revenues decreased slightly in industrial products by 0.5%, for a total of $1.5 billion. All again related to Covid-19 and lower volume and average revenues per car. Finally, revenue from agricultural products and coal increased for agricultural by 2.8% or $1.1 billion and decreased by 11.9% or $766 million, respectively.
Operating expenses decreased by $258 million or 6.7% in the first quarter for a total of $3.6 billion. Compensation and benefits expense also fell during the first quarter, to the tune of $156 million or 11.1%, primarily as a result of lower employee counts as a result of Covid-19 conditions. Fuel expenses decreased $97 million or 13.7% as a result of lower volume, improved efficiency, and lower average fuel prices.
Utilities and Energy
The utilities and energy segment is broken into different reporting sections.
PacifiCorp
After-tax earnings for this segment decreased $40 million or 21.1%, for a total of $176 million in the first quarter. Primarily as a result of lower margins for both electricity and natural gas, offset by increased income tax benefits from wind power initiatives.
PacifiCorp reported electric utility margin declined 9% to $391 in the first quarter, and natural gas utility margin decreased 21% as a result of a 16.2% reduction in customer volumes, due to milder weather in the region.
MidAtlantic Energy Company
MEC after-tax earnings for the quarter were down $40 million or 21.1% for a total of $150 million. Again due to lower electric and natural gas margins. The electric utility margin declined 9% to $391 million, and the natural gas margin declined as well by 21% to a total of both due to milder weather in the region.
NV Energy
NV Energy reported after-tax earnings of $20, a decrease of $9 million, or 31% compared to the year-ago quarter. The electric utility margin was steady at $323 million for the quarter.
Northern Powergrid
After-tax earnings for Northern Powergrid for the first quarter increased by 8.8% when compared to the year-ago quarter.
Natural Gas Pipelines
After-tax earnings for the segment decreased $2 million or 1.1% as a result of higher operating expenses and higher net interest expense.
Manufacturing, Service, and Retailing
The manufacturing sector includes Lubrizol, Precision Castparts, IMC, CTB, and others, including Scott Fetzer.
Industrial Products
Revenues for all the companies in the industrial products segment were $7.4 billion in the first quarter, which was a decrease of 4.2%. Pre-tax earnings for the Group were recorded as $1.3 billion, a decline of 8.7% compared to 2019.
PCC’s revenues for the quarter were $2.4 billion, a decrease of $173 million, or 6.6%. The pre-tax earnings for PCC decreased by 7.3% compared to the year-ago quarter.
Lubrizol reported revenues of $1.6 billion, a decrease of $72 million or 4.3%, and the pre-tax earnings decline 9.3% when compared to 2019.
Marmon’s revenues for the quarter were $2 billion, largely flat compared to prior years quarter, and the pre-tax earnings increased $2 million for the quarter or a 0.7% increase.
IMC’s revenues were $842 million for the quarter, a decrease of 5.1%, with pre-tax earnings declining 22.3% in the first quarter as well.
Building Products
Revenues for the building products group increased $295 million or 6.5% for a total of $4.9 billion in the first quarter, with pre-tax earnings $567 million, an increase of 17.6%.
Clayton Homes reported revenues of $1.8 billion with an increase of $208 million or 13.4% over the prior year’s quarter. Pre-tax earnings of $201 million was a decrease of $14 million or 6.7%.
Consumer Products
Consumer product revenues were reported as $2.8 billion, a decrease of 0.4%, with pre-tax earnings declining to $238 million, a decline of 15.3%.
Service
Service group revenues comprised of $3.4 billion, a decline of 1.8%, with the Group’s pre-tax earnings declining $47 million, a decrease of 10% for a total of $425 million.
Retailing
The revenue for the retailing Group for the quarter were $3.6 billion, flat compared to 2019. The pre-tax earnings were $133 million, a decrease of 10.7% from the prior year’s quarter.
McLane Company reported revenues of $11.8 billion, which was a decrease of 3.1% from 2019, with pre-tax earnings declining $46 million or 41.4% when compared to 2019.
Investments and Derivatives Gains/Losses
As a result of GAAP accounting rules changes, Berkshire is required to report unrealized gains or losses from market changes to their investment portfolio, which will cause the earnings for the company to fluctuate wildly. Warren Buffett and Charlie Munger both vehemently disagree with this rule but follow the accounting guidelines none the less.
Pre-tax losses in the investment portfolio included net unrealized losses in equities that Berkshire owned during the first quarter of 2020 in the amount of $68.5 billion. The losses reflect the widespread losses that occurred in the market during March of the first quarter, a direct result of Covid-19.
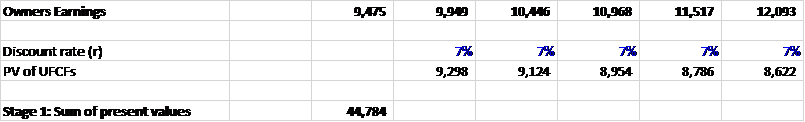
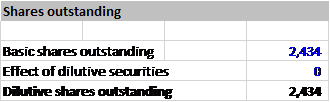
Intrinsic Value of Berkshire Hathaway
The following discounted cash flow evaluation of Berkshire Hathaway is not meant to be investment advice, rather a model that you can base your assumptions on and give you a rough idea of a fair market price.
I will include my assumptions so you can follow along, as well as a range estimating the discount rate used.
Assuming:
Growth Rate of Owner Earnings – 5%
Discount Rate – 7%
Terminal Rate – 2%

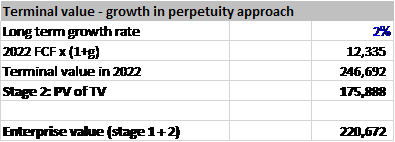

Other ranges using different discount rates, keeping the growth and terminal values the same.
6% – $201.41
8% – $163.20
Final Thoughts
Thank you for reading the recap of Berkshire Hathaway’s first-quarter performance. As you may or may not know, Berkshire doesn’t offer any sort of guidance from quarter to quarter, so there is no earnings guidance, and since Berkshire doesn’t pay a dividend and buybacks have been suspended there is no discussion of capital allocation to shareholders this quarter.
The above summary is meant for educational purposes only; please don’t buy any shares of the company without first doing your due diligence.
Take care and be safe out there,
Dave
