The CAPM (Capital Asset Pricing Model) is commonly used to estimate a discount rate for cash flows in a DCF calculation (in particular, the cost of equity). This post will highlight a few of the CAPM assumptions that led to the creation of theory.
What’s the CAPM trying to do?
Basically, taking the conclusions from Markowitz’s theory about risk and return, the CAPM tries to represent the inherent riskiness of an asset (as an investment) by taking various assumptions and estimates.

The theory goes—a stock (or asset) that has been more volatile (in price) in the past is likely to be a risker investment in the future, and it should be discounted appropriately (at a higher discount rate).
And also—a stock in a riskier environment, say in a country where political pressures are more likely to affect its economy (which is a situation usually identified with higher interest rates), should also have its projected cash flows to be discounted higher because of the increased risk exposure compared to an investment in a more stable environment. This is commonly known as the market risk premium and goes into the WACC.
To fully understand the basics of the CAPM model and its assumptions, we must understand that this theory (and others) assume that investors view price/ valuation not on a completely absolute basis but as it relates to other investment opportunities out there—which is what makes CAPM a practical tool.
The CAPM Model: A Practical Tool in Valuation
I know we like to get to the juicy stuff right away, so let’s show the CAPM model in its full form “in the wild”, as part of a Discounted Cash Flow Model.
The CAPM helps investors to estimate a cost of capital on the cash flows of an investment. In other words, what’s the opportunity cost for investing in this asset vs. another?
Because the CAPM as it has evolved today includes “beta” as a part of its formula, relying on historical stock price for this calculation of beta, its application in a DCF valuation is for the cost of equity. Cost of equity, as you might recall, is a component of the Weighted Average Cost of Capital (WACC) essential in any DCF analysis.
Here’s the CAPM model as it appears as the Cost of Equity (and also the WACC if looking 100% at equity, and not considering Cost of Debt or Cost of Preferred):
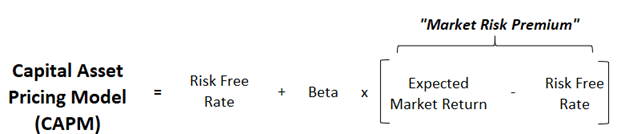
We can go in-depth into each component further, but first let’s test the CAPM itself and why it’s been annotated in this way for today’s textbooks.
Assumptions to the CAPM Model
For this model to work as a adequate measurement of risk appetite, and thus how much (or little) to discount cash flows to arrive at the price of a security, a few things about the market, investors, etc must be true.
- Systemic risk for the security measured by beta
- Returns are normally distributed, similar to a bell curve
- Expectations about the market are homogenous
- Markets are efficient and reflect all available information
- Investors are rational, and markets are in equilibrium
- Money can be borrowed with no limit at a risk-free rate
- No transaction costs and ample liquidity for trading the asset
Let’s expand on these assumptions, as some assumptions may have more validity (or probability, if you’d like to think that way) than others. And some of these CAPM assumptions bring inherent pros and cons to the application of the CAPM model.
Systemic Risk and Normally Distributed Returns
I’ve put these two assumptions at the top as they are among the most hotly debated and widely critized components of the CAPM model.
As I mentioned in my post about Markowitz, famed author Nassim Taleb has studied risk in the stock market and shown that sometimes there is a tail risk that can’t be accurately described by a bell curve distribution. The order of magnitude in difference between the results of a bell curve vs a “tail” can be so significant, to render a quantification of risk as normally distributed almost useless.
Taleb describes it in this way:
“Take a population of 10 people, 9 having a net worth of $ 30,000 and 1 having a net worth of $ 1,000. The average net worth is $ 27,100 and 9 out of 10 people will have above average wealth.”
Most of the time, stock markets don’t fall into tail risk– or four, five, or six sigma type events such as the crash before the Great Depression, or the Black Monday Crash of 1987, or the Corona Crash (of 2020). So, most of the time, an almost overwhelmingly large majority of the time, tail risk, and the vast array of return distribution is a non-issue and so when it doesn’t factor into the CAPM model, there’s generally no harm, no foul.
But whether practitioners are adversely affected by this disadvantage of the CAPM or not, they should still be aware of this limitation—that tail risk can make an estimation of risk invalid.
Beta as a measure of systemic risk
The implication of the CAPM assumption, that beta is an adequate measure of systemic risk, could render the CAPM model completely useless, if taken completely at face value.
However, this doesn’t have to be the case for the smart practitioner of the CAPM model.
Particularly if that practitioner is confident that there’s other sources of risk, which have been considered, and that a beta is appropriately adjusted in the case that its value is compleley misrepresenting the true inherent risk.
I’ll take an extreme example as an illustration. Review the application of beta in the cost of equity/ CAPM formula.
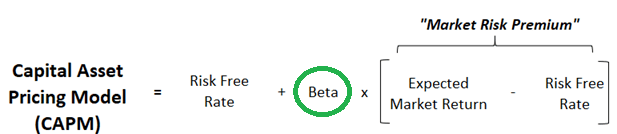
Say that a beta calculation tells you that a stock’s beta is very close to zero, such as 0.01. Regardless of what you set for Expected Market Return and, subsequently, the Market Risk Premium, a beta so close to zero will return a value of [beta * Market Risk Premium] to also very close to zero.
The [beta * Market Risk Premium] calculation makes up 50% of the Cost of Equity formula (represented by the CAPM). The other 50% is the risk-free rate.
Stating that [beta * Market Risk Premium] is close to zero implies that your investment is essentially risk-free. That’s highly unlikely unless you are actually investing in a “risk free” investment such as a government bond.
You might think that only government bonds would trade at such low betas, but that’s not always the case. Take an example like this article amidst the early innings of the coronavirus crash. They reported these betas:
- Dollar Tree: 0
- Autozone: 0.07
- Tiffany & Co: 0.13
Each of these stocks obviously have a risk of both bankruptcy (complete loss of capital), and other forms of unsystemic risk.
And what I find more comical about this illustration, was that Tiffany & Co was a stock I owned during this crisis. I knew for a fact that it was announced that they were to be acquired at $135.
And so, predictably, the stock traded close to $135, with a little margin to account for the chance that the deal fell through. Fast forward a little while and the stock dipped to the $120 range, as market volatility and other economic developments cast fear into the chances that the accepted deal would still fall through.
So you had 2 components of real risk, #1 that the stock would go down, and it did as market volatility rose, and #2 that the stock goes bankrupt, which is always a risk for a publicly traded company at any given time.
But, according to beta, this shouold’ve been a riskless investment—which is why it’s so critical to apply the CAPM with additional context and a deeper understanding.
The betas I highlighted above are obviously exceptions to the rule, but that doesn’t mean that there won’t always be those. And so, as a rule, using beta as a measure of risk has an inherent weakness because of the “risk” of mis-application of these rules.
Another perfect example: the low beta ETF. Is there an algo that blindly trades these metrics? Or is it managed by a human, making it vulnerable to all of the biases that comes with that task? Sorry people, there’s just no perfect answer for anything markets and investments…
The Efficient Market Assumption
There has been a lot of discourse around the subject of the efficient market hypothesis, and much of it has been said much more elegantly than I, by some of the brightest guys in the world—Warren Buffett, Charlie Munger, George Soros, the list goes on.
Where the discussion can get lost in the weeds a bit is to what extent the market is efficient, because I think most can agree that the market does display attributes of efficiency at times, or even most of the time.
But whether that feature can be extrapolated to mean that markets are efficient enough to cause active management of stocks to be a waste of time and determinantal, or whether that means that the CAPM is an accurate representation of asset prices, is again—open to interpretation.
Based on what we know about the CAPM today, this assumption needs to be confirmed for the CAPM to be used as intended.
Other assumptions can be baked into this primary efficient market assumption as well, namely that investors that are rational, markets are in equilibrium, and that these things happen most if not all of the time.
It’s tough to precisely quantify between practicality and theory, which makes the literal interpretation of these statements also tough to quantify.
In other words, how much markets are efficient, or to what frequency or scale are investors rational, or how much and how often are markets in equilibrium, all mean different things to different types of people—such as academics and practitioners.
So be careful about making assumptions about these assumptions.
Fees and Liquidity
For the markets to regulate themselves in the sense that it discovers inefficiencies in pricing and quickly corrects them, the markets themselves need to be liquid and without fees.
Fees deteriorate the effectiveness of arbitrage trades that close the gap on pricing efficiencies, and to the extent that these fees are higher, the less that the CAPM can be relied on as a pricing estimate for that asset.
Liquidity goes along step-by-step with fees, as a non-liquid market will (likely) lead to assets being carried at inefficient prices (relative to their real value), without self-correcting market forces closing the gap.
Perhaps this is why you don’t often hear about CAPM when it comes to the real estate market, as that market is much less liquid and involves much greater fees than something like the stock market.
A final CAPM assumption that you can tie in with the above is that investors can borrow unlimited amounts at the risk-free rate, to also close the gap with pricing inefficiencies as they relate to interest rates and discount rates. In the real world, this feature has real world limits.
Conclusions about CAPM Assumptions
After spending so much time seemingly debunking parts of the CAPM model and its assumptions, you’d think I’d be writing it off as an impractical spawn of the ivory world of academia.
But as a practioner, the fact remains that cash flows will always have to be discounted in order to evaluate whether deploying cash into an investment for future cash flows is likely to be worth more than the cash at hand today.
And as it relates to the CAPM as a tool to calculating the cost of equity, which directly feeds into the Weighted Average Cost of Capital (WACC), there’s really few better alternatives out there today.
The problem with many of the assumptions that are required to call the CAPM a perfect tool for estimating value is that the assumptions themselves are imperfect. There are always exceptions to the rule and varying degrees that assumptions may hold true or be practical in the real world.
All-in-all, the CAPM formula is a fantastic resource for estimating the valuation of stocks, if used intelligently and responsibly.
By understanding that there are limitations to the assumptions behind the CAPM, the investor can also understand there are limitations to the effectiveness of the CAPM as a model for estimating the valuation of an asset.
By understanding those limitations, and mastering the theory of CAPM enough to really comprehend the strengths and weaknesses in the model, one can use it effectively in many profitable endeavors.

Andrew Sather
Andrew has always believed that average investors have so much potential to build wealth, through the power of patience, a long-term mindset, and compound interest.
