Updated 4/4/2024
“There is a huge difference between the business that grows and requires lots of capital to do so and the business that grows and doesn’t require capital.”
Warren Buffett, from Warren Buffett and the Interpretations of Financial Statements
Cash is king, and Buffett has built quite a kingdom, with the latest balance sheet reporting that he has $128 billion.
The cash flow statement is one of the required reports for financial reporting for all publicly traded companies. Still, it is probably the most misunderstood of the big three and beyond calculating free cash flow.
This statement contains a wealth of information; we can use all kinds of ratios to unlock that information and gain from it. We can find a company’s liquidity, capital expenditures, etc.
Want to find out how much a company spends on dividends or share repurchases? The cash flow statement provides all the information.
Running a cash flow analysis and determining where the money went is a little like we do every month: wondering where that $20 bill in our wallet went. The same applies to the cash flow statement; we can work down the list and discover some gems to help us determine our company’s financial health.
Determining where the cash went is essential for deciding what kind of free cash flow is available for other opportunities for reinvestment or purchases.
Due to the global pandemic, the market’s attention has rightfully returned to companies’ balance sheets. However, a cash flow analysis can help as much as possible and is not difficult.
In today’s post, we will learn:
- What is a Cash Flow Analysis?
- The Difference Between Accrual and Cash Accounting
- The Three Sections of the Cash Flow Statement
- Cash Flow Ratios Everyone Should Know and Use
What is a Cash Flow Analysis?
A statement of cash flows shows how a company spends its cash (outflows) and where it receives its money (inflows).

The cash flow statement includes all the cash inflows a company will receive from operations and outside investment sources. Additionally, it will consist of all the cash outflows that pay for activities and reinvestments during each period.
Cash flow analysis involves examining a cash flow statement and analyzing all the cash inflows and outflows from the business. It will examine cash inflows and outflows from operations, financing, and investment activities.
In plain English, we examine how a company makes money, where the sources of cash come from, and their value.
We need to learn about accounting before we analyze a cash flow statement. It won’t be boring, I promise.
The Difference Between Accrual and Cash Accounting
In accounting, two types of data are used to create our reports.
- Accrual accounting
- Cash accounting
Let’s discuss accrual accounting first.

Most companies use accrual accounting, which reports revenue as income when earned rather than when the company gets paid. Expenses are recorded when they happen, even though the expense has not been paid for yet.
For example, if we sell an iPhone, we record the income on the income statement even though we haven’t been paid for the phone yet. The company would profit from the sale and pay taxes from an accounting standpoint. However, no cash has been received. Another point is that there would be cash outflows initially because money must be spent on buying inventory and making the iPhone.
Most companies extend credit to their suppliers to pay their invoices, with standard terms of 30, 60, and 90 days, depending on the industry and supplier relationship. This sale would be an account receivable on the balance sheet with zero impact on the cash until it is received.
Cash accounting is the other method of accounting. In this method, you account for sales when they are received and expenses when they are paid.
On the income statement, a company’s profit is listed as net income; it is considered the bottom line for all companies. However, because accrual accounting is utilized, not all net income means that all receivables have been received from customers. In other words, even though the company is listing a profit, there may still be monies owed to them from distributors that have purchased their product but have not paid for it yet.
The company might be profitable from a financial accounting standpoint, but the company could have financial issues if the receivables are not paid on time or are never collected. Even the best companies can struggle to manage their cash flow adequately, so a cash flow analysis is critical in our toolbox when evaluating companies.
Ok, now on to the three sections of the cash flow statement.
The Three Sections of the Cash Flow Statement
The cash flow statement has three distinct sections broken out into three components.
- Operations
- Financing
- Investments
Each of these segments has a particular impact on the business. We will discuss each section in turn.
Cash Flow from Operations
Cash Flow from Operations (CFO) – This section records the net income from the income statement. Items included in this section are accounts receivable, accounts payable, and income taxes payable.
Cash flow from operations is the lifeblood of the business; it proves that positive cash flow can sustain the company before making any long-term investments, such as buying a new production plant.
This section starts with the net income and adjusts as cash changes hands. For example, if a supplier pays a receivable, it would be recorded as cash from operations. Changes in current assets and current liabilities are recorded here in the cash flow from operations.
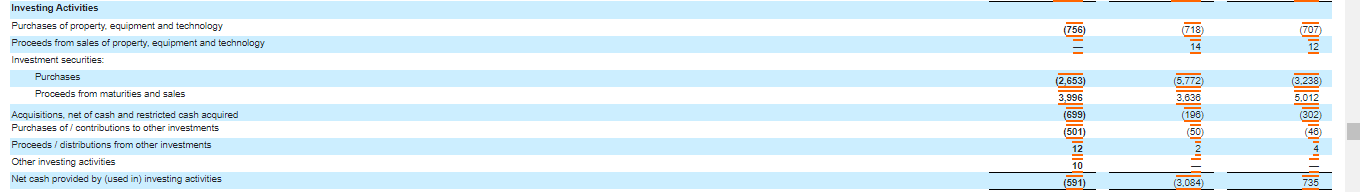
Cash Flow from Investing Activites
Cash Flow from Investing Activities—In this section, cash flows from sales and purchases of long-term assets like property, plant, and equipment (PPE) can include vehicles, buildings, land, and equipment.
Buying fixed assets like PPE requires capital expenditure and a cash outflow. These transactions include things like buying a new production plant and investment securities.
Cash inflows flow from selling these assets, such as fixed assets, business segments, or whole businesses, and selling investment securities.
This section is particularly interested in cash outflows for capital expenditures for maintenance or purchasing physical assets that support the business’s continued success.
This section outlines any cash paid out to invest in the business.
This section contains notes about free cash flows, item capex, or capital expenditures. To quickly calculate free cash flow, you can take cash flow from operations and subtract the capex from the investing section. Of course, we can get more granular and uncover more in the upcoming section, but this is a quick and dirty way to approximate free cash flow.
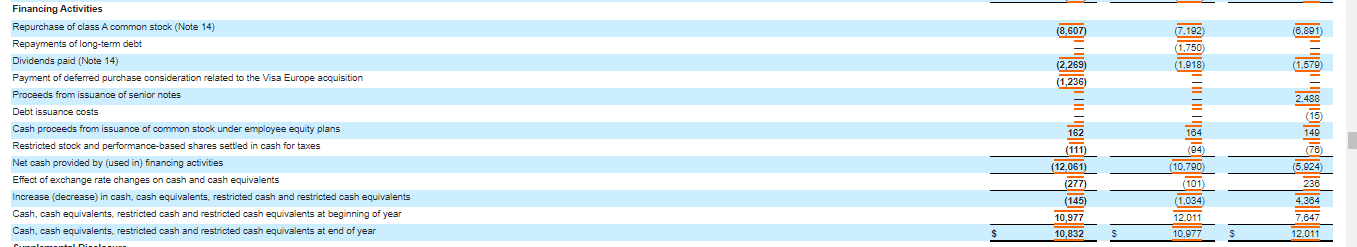
Cash Flow from Financing Activites
Cash Flow from Financing Activities – the home of debt and equity transactions is cash flow from financing activities. Here, we will find cash outflows for dividends, share buybacks, and purchases of bonds. We will also see cash inflows from stock sales. Any monies received from taking a loan or any cash the company used to pay down long-term debt will be recorded here.
This section is important for dividend investors because we can see cash dividends paid, not the net income used to pay for the dividends. That is of concern because we want a company that can sustain its dividends from the business’s operations rather than taking on more debt.
This is probably our favorite section for investors because we can see equity being returned to us via dividends or buybacks and the source of those equity returns.
Now that we have covered the basics of the cash flow statement let’s analyze a business’s cash flow.
For more info on the cash flow statement, specifically on some of the more important line items, check out this great article by Cameron Smith.
Cash Flow Ratios Everyone Should Know and Use
Analyzing the cash flow statement is usually the last item on the list, but let’s examine some ratios that can help us define a business’s financial health.
I said earlier that cash is king; remember that earnings grow from cash, not vice versa. Wall Street focuses much of its attention on earnings and not cash when it should be the other way around.
When we analyze the cash flow statement using ratios, comparing similar companies, such as apples to apples is crucial. Using those kinds of comparisons will give you some anchors to tell whether or not that number is a good one; in a vacuum, it is too hard to say.
Most financial experts define cash flow as the net cash with depreciation added back in. It is better to use the net operating cash flow from operations and add back the capex, as depreciation is a non-cash charge.
Ok, enough talk; let’s get to the ratios.
Before proceeding, you can substitute free cash flow for other cash flows in the following ratios.
The first ratio is:
Operating Cash Flow Ratio
Operating Cash Flow Ratio – With this ratio, we can determine how many dollars of cash we get from our sales. Unlike most balance sheet ratios, there is no defined “good” number to be above or below. Typically, we want a higher ratio than a lower one.
Operating Cash Flow Ratio = Cash Flows From Operations (CFO) / Sales (Revenues)
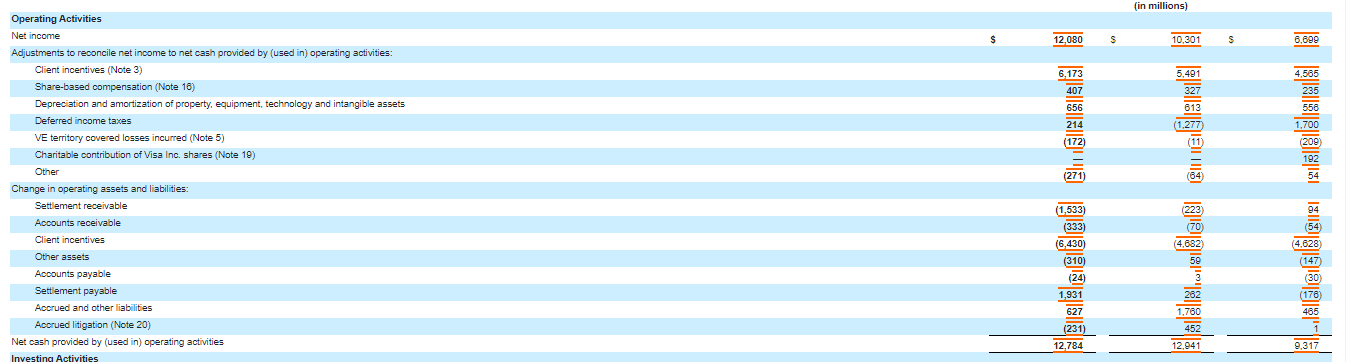
Ok, let’s use Visa to continue our exploration of their cash flow statement.
We will look at the income statement from their latest 10-k to find the sales.

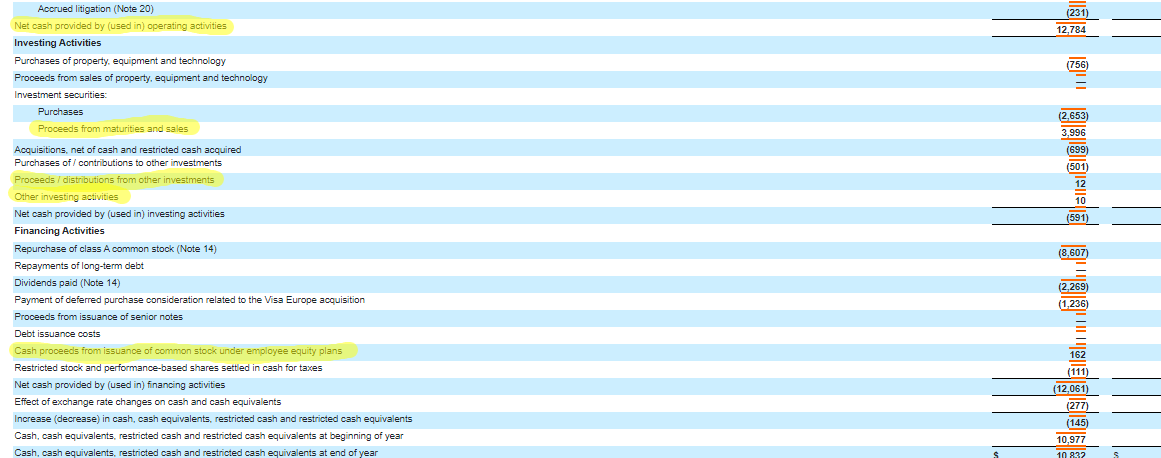
And the net cash flow from operations.
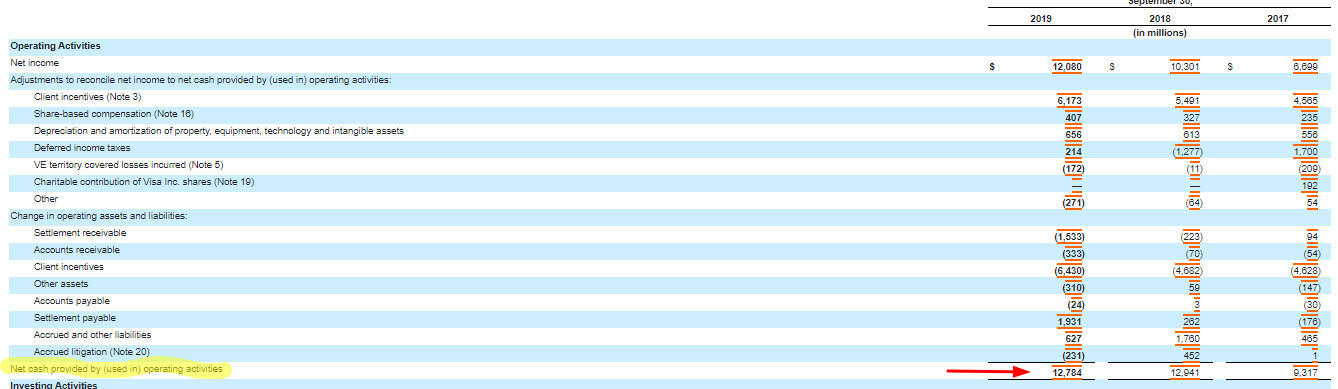
Our numbers for our ratio are:
- Sales = $22,977
- Cash flow From Operations = $12,784
Before we go, a note that all numbers will be listed in millions unless otherwise stated.
Back to our ratio:
Operating Cash Flow Ratio = CFO / Sales
Operating Cash Flow Ratio = 12784 / 22977
Operating Cash Flow Ratio = 55%
So, for every dollar of sales, we produce $0.55 of operating cash flow, which is pretty impressive!
Quickly, I will put together the last two years of the same ratio to give us some context.
- 2018 CFO Ratio = 12941 / 20609
- 2018 CFO Ratio = 62.7%
- 2017 CFO Ratio = 9317 / 18358
- 2017 CFO Ratio = 50.8%
Okay, that gives us an idea of how Visa has created cash flow from its sales over the last three years. Later, we will compare these numbers to Mastercard to get a reference point.
Asset Efficiency Ratio
Remember Return on Assets? This ratio is similar, except we use cash flow from operations instead of net income. This ratio will show how a company uses its assets to create cash flow. Using this ratio over a longer time is best to get a feel for using assets.
We already have our cash flow from operations, so I will now look at the balance sheet for our total assets.
Asset Efficiency Ratio = Cash Flow from Operations / Total Assets

2019 Asset Efficiency Rato = 12784 / 72574
2019 Asset Efficiency Ratio = 17.61%
I will use the ratios from the last five years to give us a historical perspective.
- 2018 18.69%
- 2017 13.71%
- 2016 8.7%
- 2015 16.72%
- 2014 18.68%
It looks like it has been pretty consistent over the six years, with one odd number in 2016.
Current Liability Coverage Ratio
This is an excellent ratio to test for solvency. Another simple ratio, this ratio tells us about the company’s debt management.
For this ratio, we will use our cash flow from operations, as before, but we will subtract dividends paid to give us a more accurate picture of the operating cash flows.
Current Liability Coverage Ratio = ( CFO – Dividends Paid ) / Current Liabilities.
So, we go back to the cash flow statement to find the dividends paid under the cash flows from the financing section and then back to the balance sheet for the current liabilities.
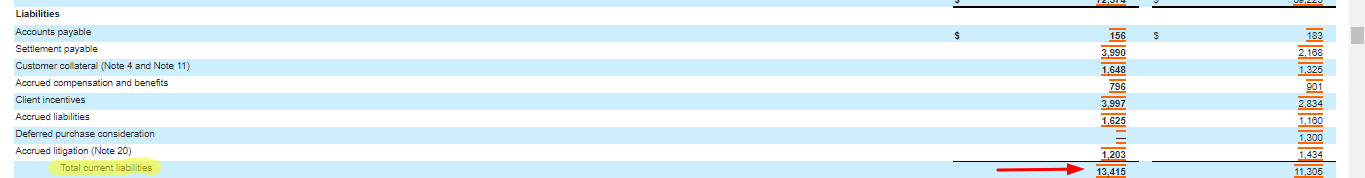
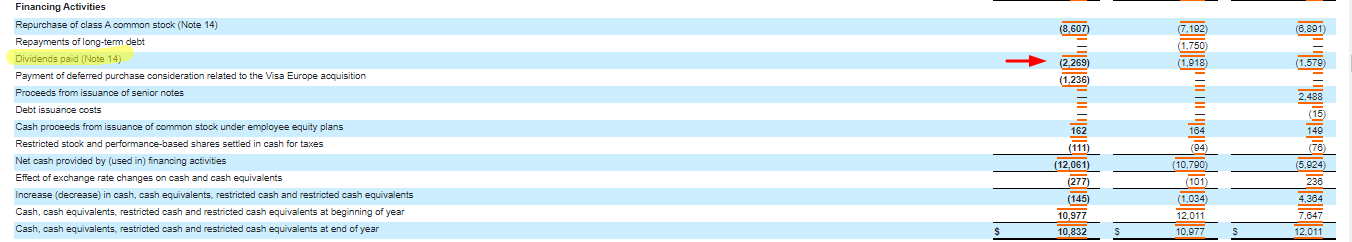
Cash for dividends paid = $2,269
Current Liabilities = $13,415
We are plugging in our numbers for our formula.
Current Liability Coverage Ratio = ( 12784 – 2269 ) / 13415
Current Liability Coverage Ratio = 78.3%
I will combine the same ratio over the last four years to understand their coverage ability.
- 2018 97.5%
- 2017 77.4%
- 2016 52.4%
- 2015 100.1%
The higher the number, the more we like it; if it drops below 100%, it cannot pay for current liabilities, which is a more accurate indicator of the company’s ability to pay its current liabilities than the current or quick ratio.
We can use the same ratio with short-term debt and free cash flow. This ratio is a great way to analyze a company’s short-term stability; for example, it would be an excellent ratio to deploy during this current market volatility.
Long-Term Debt Coverage Ratio
If we measure short-term liabilities, we might as well look at a ratio for long-term debt. It is a great practice to split the two liabilities, short-term and long-term debt, to get a real sense of what is owed in the short and long term.
The higher the number, the more cash is required to pay off the debt from operations.
Long-term Debt Coverage Ratio = ( CFO – Dividends ) / Long-term Debt
We will return to the balance sheet for the long-term debt, which is the other number we already have.
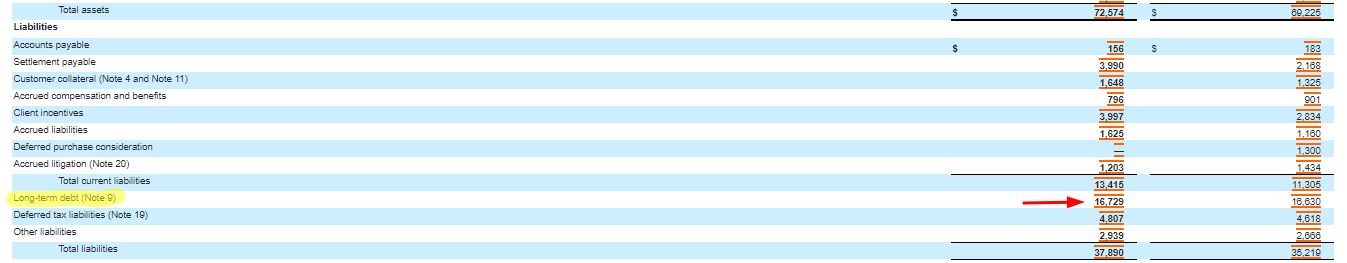
Long-term Debt Coverage Ratio:
- Cash From Operations – 12784
- Dividends Paid – 2269
- Long-term Debt – 16729
Long-term Debt Coverage Ratio = ( 12784 – 2269 ) / 16729
Long-term Debt Coverage Ratio = 62.8%
Interest Coverage Ratio
The ratio above shows the company’s ability to pay its interest on its current debt. A highly leveraged company will have a low multiple and a company with a superior balance sheet will have a higher multiple. If the interest coverage is less than one, the company is at risk of default.
Interest Coverage Ratio = ( Cash from Operations + Interest Paid + Taxes Paid ) / Interest Paid
We return to the cash flow statement for all the data for this ratio.

Numbers for our ratio:
- Cash flow from Operations – $12,784
- Interest Paid – $537
- Taxes Paid – $2648
I was plugging in all the numbers.
Interest Coverage Ratio = ( 12784 + 537 + 2648 ) / 537
Interest Coverage Ratio = 29.7x
The above calculation shows that Visa has 29 times the cash flow to meet its interest payments.
Cash Generating Power Ratio
You must love this ratio’s name; it is right up Andrew’s alley.
The above ratio illustrates the company’s ability to create cash solely from operations compared to its total cash inflow.
The twist is that we use the cash inflows from the investing and financing activities instead of total cash.
I will use Visa’s cash flow statement to illustrate how this works.
Cash Generating Power Ratio = Cash from Operations / ( CFO + Cash from Investing Inflows + Cash from Finance Inflows )
Our numbers from the cash flow statement:
- Cash from Operations – $12,784
- Cash from Investing Inflows – $4,018
- Cash from Finance Inflows – $162
Cash Generating Power Ratio = 12784 / ( 12784 + 4018 + 162 )
Cash Generating Power Ratio = 75.2%
Let’s examine the next four years for a five-year snapshot of Visa’s cash-generating ability.
- 2018 77.29%
- 2017 64.33%
- 2016 18.28%
- 2015 72.24%
Looking at the cash inflows in Visa, we notice they are surviving on their cash from operations, which is very comforting.
External Financing Index Ratio
The financing ratio tells us how dependent a company is on financing for its cash flow.
It compares the cash flow from financing to the cash flow from operations. The higher the number, the more dependent the company is on financing. Some of the most reliable companies will have negative numbers; they can repay all their financing from net cash, such as dividends and debt. In this case, the ratio will be negative, which is good.
External Financing Index Ratio = Cash From Financing / Cash from Operations

Numbers from the cash flow statement:
- Cash from Operations – $12,784
- Cash from Financing – -$12,061
External Financing Index Ratio = -12061 / 12784
External Financing Index Ratio = -94.7%
We have had a good rundown of useful ratios for analyzing a company’s cash flows. Let’s look at a comparison by using the same numbers from Visa, and I will compare them to Mastercard to give us an idea of the strength of either company.
Using the chart above, we can see that both Visa and Mastercard have strong cash flows. Based on our ratios analysis, Visa has superior operating cash flows, current liability coverage, and external financing, while Mastercard has strengths in these areas.
Doing this kind of analysis is a great exercise to dig deeper into the numbers of any company you are investigating.
Final Thoughts
The ratios we have learned today are all straightforward to navigate. This kind of cash flow analysis is another skill we can add to our arsenal of investigative tools when examining each section of the financial statements.
I strongly encourage you to add this list of ratios to your investment checklist as you examine a company to discover its strengths and weaknesses.
Every company will have its strengths and weaknesses; our job is to uncover those systematically and rationally. A cash flow analysis is a great way to discover a company’s ability to grow, use, and generate more cash from its operations, financing, and investments.
Remember that cash is king; the stronger the cash generation, the stronger the company.
Your homework is to do five cash flow analyses of any company you wish and email them to me. I will then check your work.
Thank you for reading this article, and I hope you find it useful in your investing journey.
If you have any questions, please don’t hesitate to reach out.
Until next time, take care and stay safe,
Dave

Dave Ahern
Dave, a self-taught investor, empowers investors to start investing by demystifying the stock market.
