This article will present a valuation estimate based on two common valuation methods for financial companies. It provides a template that investors can use to analyze stocks like Schwab which rely on interest rates for income.
Charles Schwab (SCHW) completed its acquisition of TD Ameritrade, and the addition of the AUM (assets under management) will help power an increase in the NIM for the company.
Schwab eliminated trading fees late in 2019 and has been undergoing a transition to other growth methods, such as lowering costs on its platforms, plus bringing economies of scale to bear to improve those margins.
![]()
On an intrinsic basis, the company is undervalued, both on a dividend discount model and excess return model basis. The company has set itself up to grow its profitability from lower costs and further cost savings from technology by adding AUM.
Schwab is a potential solid investment that could grow eight to twelve percent annually.
Let’s check out what is going on under the hood.
Overview
The Charles Schwab Corporation reported third-quarter earnings on October 15th, 2020. Let’s take a look at the company and its results.
Charles Schwab provides wealth management, securities brokerage, banking, and asset management through its two segments:
- Investor Services
- Advisor Services
The Investor Services segment provides retail brokerage, banking, and retirement plans to its customers. The Advisor Services offer many different services, including custodial, trading, and corporate brokerage retirement services.
Founded in 1971, Schwab carries a market cap of $77.21 billion, with total client assets of $4.4 trillion, and recently closed on its acquisition of TD Ameritrade on October 6th.
Let’s look at the company’s performance for the quarter.
Schwab’s net new assets totaled $51.2 billion in the third quarter, not offset as much as anticipated by the later than usual tax filing season of July. Additionally, there were $8.5 billion in inflows from the closing of the acquisition of Wasmer, Schroeder & Company, LLC, with core net new assets totaled $42.7 billion in the quarter, which brought the year-to-date core net new assets to $162.5 billion. All of which represents 5% growth annualized.
New brokerage accounts grew to 592 thousand in the quarter, with the total period accounts ending at 14.4 million, all of which was a 19 percent increase from the year-ago quarter.
Schwab observed average daily trades of 1.5 million in the quarter and the first nine months of 2020, each of which increased 103% and 109% from the same periods of 2019, respectively. Total client assets ended the quarter up 17%, for $4.4 trillion.
Schwab’s net income for the third quarter of 2020 was $698 million, a 27 percent decrease. With diluted earnings per share of $0.48, they were declining 31 percent. Adjusted earnings per share, which were exclusive of certain charges such as acquisition and integration-related costs, related income tax effects, and amortized costs, were $0.51 per share, also down 27 percent for the quarter.
The company’s total net revenues were $2.4 billion in the third quarter, down 10%, primarily from the decline in net interest revenue. The net interest revenue did see bumps in the quarter from rising interest-earning assets during the third quarter but still decreased $288 million in the quarter.
Schwab reported that the declines in net interest revenues were primarily a result of declining short and long-term interest rates driven by the Fed’s monetary easing, plus the speeding up of prepayment prepayments on mortgage-backed securities in the company’s investment portfolio.
Asset management and administration fees rose 4 percent in the quarter, totaling $860 million, compared to the similar quarter of 2019. Schwab reported that the increases were a result of rising balances in the advisory solutions.
However, trading revenues declined 12 percent for the quarter compared to the same quarter in 2019.
Total expenses, excluding interest, were $1.6 billion for the quarter, which decreased by 6 percent compared to 2019. The total expenses excluded interest and expenses related to acquisitions and integration-related costs and amortization of acquired tangible assets.
Schwab’s total balance sheet assets grew five percent for a total of $419.4 billion at quarters end. The growth in assets represented growth in the company’s client base and continuing higher client cash allocations due to the lower attractiveness of fixed income options or additional cash alternatives in the low-interest-rate environment.
Schwab’s Tier 1 leverage ratio was 5.7% at the quarter’s end. The company issued $2.5 billion in preferred stock, which raised the total preferred stock to $5.3 billion, or approximately 23 percent of Schwab’s Tier 1 Capital.
The company reported a return on average common stockholder’s equity of 10% for the quarter, down 20 percent. Also, down by 21 percent was the return on tangible common equity of 12 percent.
The big news of the quarter was the closing of the TD Ameritrade acquisition. The merger helps Schwab grow its client’s assets to approximately $6 trillion and 29 billion brokerage accounts. With the inclusion of TD Ameritrade, Schwab expects to lower total expenses as a percentage of the client’s assets. The company expects the integration to take between 18 to 36 months to complete, with the incorporation of TD Ameritrade into the two existing segments.
In the fourth quarter of 2020, Schwab will begin recognizing bank deposit account fee revenues from the merger as a separate line item on its income statement.
Okay, now that we have discussed Schwab’s third-quarter performance, let’s look at the company’s growth prospects.
Growth Story
The growth story for Schwab revolves around two points, fees and AUM (assets under management).
First, let’s look at fees for a moment.
Lots of investors questioned how Schwab would function with the elimination of fees in late 2019. But at the time, those fees were only 8 percent of Schwab’s revenues.
To counteract the reduction in fees, which by the way, Schwab saw coming. Schwab began commoditizing services its services with automation. Schwab started expanding into higher-value services while commoditizing lower-value services by utilizing automation to lower costs.
Schwab bank takes the cash that sits in customer’s accounts and sweeps it into a bank. Schwab pays an interest rate on that and gets to use that “float” and invest it in higher yield investments that Schwab collects the difference in the yield they receive versus what they pay out to customers.
The net interest margin helped build the bank in the brokerage and asset management business and now accounts for over 60% of its revenues. The net interest margin over the last four quarters has hovered around 2.06, with:
- Dec19 – 2.74
- Mar20 – 2.46
- Jun20 – 1.82
- Sep20 – 1.56
With the reduction in trading fees, 40% of NIM fees come from advisory services/asset management, fees on mutual funds, ETFs, and mutual fund distribution platform fees.
Schwab’s path to profitability will come from combining two things, lower costs and enticing more customers to trust their funds with the company.
Schwab entices customers by lowering explicit fees and offering more and more services, more and more choices on Schwab for a lower and lower fee as a customer, which accelerates the flywheel of bringing in more customers and bringing in more assets, which then increases the scale and reduces Schwab’s costs.
Schwab operates on an RIA platform; the more assets, Schwab’s lower expense per dollar. The bigger scale they get, the more cost advantage they have, the lower Schwab can bring the prices, which allows them to bring in more and more customers and assets.
However, they charge an implicit fee; you can take the cash in your account and buy something else with your excess cash and remove Schwab’s ability to reinvest those funds.
Most clients or customers like to have a cash balance, allowing Schwab to take advantage of that cash pool to redeploy in Schwab bank to earn Schwab more profits.
On an incremental plus basis, the Schwab bank profits have an 80% margin to it, which becomes an implicit cost to the client/customer because they aren’t directly paying a fee, but it is money they are earning much with while it resides in the account.
Schwab is more on the fixed cost side of asset management; the company has built a platform that allows them to bring on more client’s assets while lowering the costs per assets acquired. Their costs scaled very slowly compared to the assets managed.
Schwab has over $6 trillion in assets managed, which all sit on this platform with the costs fixed, the more assets Schwab can bring to the table, the lower the amortization of those fixed costs over every dollar of assets.
EOCA – expenses on client assets – reflects that ability to have a low-cost basis per dollar of assets managed for the client.
The cost advantage gives Schwab more pricing power, which we Warren Buffett acolytes love.
In Schwab’s case, their platform allows them to lower prices, which attract customers, without damaging the margins. And as Schwab lowers its costs faster than its prices, those margins will improve, which is a great strategic advantage.
Schwab’s platform is at 16 basis points per dollar of assets managed for clients. Which is much lower than their direct competitors Ameritrade is at 27 basis points, Etrade is at 37 basis points, BoA/Morgan Stanley is at over 50 basis points.
Schwab is going up the value scale and competing with the big boys:
- BoA
- Morgan Stanley
- UBS
- JP Morgan
The costs are much lower than the traditional brokers who offer full service, such as research teams, where Schwab doesn’t offer a lot in the research, but they offer a platform to express the investor’s views.
The elimination of fees has damaged Ameritrade and ETrade’s businesses, which has allowed Schwab to take advantage of that situation by acquiring Ameritrade, which adds another $1.5 trillion in assets, which further adds to the value improve its expenses on clients assets.
One of the keys to Schwab’s growth and profitability is their AUM’s growth, which we can track monthly. Based on the month-end October report, Schwab’s AUM was $5.88 Trillion, up 53% from October 2019 and up 34 percent from September 2020. Of course, much of that increase is due to the finalization of the TD Ameritrade acquisition.
But the point is the focus on AUM growth is the key to growth for Schwab; on a month to month basis, the company has seen organic growth in net new assets, which means its gross assets coming in minus assets leaving. Net new assets have been growing 5 to 7 percent over the last few years.
AUM growth tells us about the company’s health by attracting new customers to the platform.
Net interest margin – the difference between the assets it owns from customer cash balances, less what they pay out to customers, all of which tells us the profitability of Schwab’s assets. We determine how much cash clients hold as a percentage of their AUM, currently in the 13.4% range. Over the last month, that percentage has grown 60 basis points, and yearly, it has grown 210 basis points.
As those percentages grow, with the addition of new assets, the NIM for Schwab will grow to the pre-Covid level, thus increasing profitability. Schwab’s race is to simultaneously grow its NIM margin and lower costs, all of which will grow Schwab’s profitability.
Let’s move on and look at some of the risks Schwab faces, now and in the future.
Risks
The first risk is competition in the form of upstarts like Robinhood.
Silver bullet test: Warren Buffett talks about giving a company one silver bullet to kill its competitor, and Robinhood would be that silver bullet for Schwab.
Robinhood, while young and early in the game, is attracting younger and younger customers, and in the AUM game, whoever can get in early has a leg up on the competition. Robinhood, with its attractive interface, especially to younger investors, attracts first-time investors.
As the popularity of trading continues to grow, and Robinhood’s video game-like platform increases the attraction to the younger generation, those investors will grow their assets over time. That growth threatens Schwab in the long-run, and Schwab’s ability to attract those investors will be a challenge in the future for the company to undertake.
The low-interest-rate environment negatively impacted Schwab, as the company earned much higher yields when higher interest rates were higher. For example, a few years ago, their fixed-income investments could earn them 250 basis points, where now the 4th quarter NIM is expected to be in the mid to high 140 basis points, which is 1.4 to 1.5%. Down dramatically from the 2.4% a couple of quarters ago. That is pure profit that Schwab has lost.
Valuation Models
Next, let’s take a look at some valuations of Schwab, my favorite part.
First, if we look at the company on a relative basis, Schwab grades out at an F from Seeking Alpha. The company sports a P/E GAAP TTM of 22.60, compared to the sector median of 12.82, a 76.24% increase over the median. In comparison, the current P/E is also 4.59% lower than its five-year average of 23.69.
Next, looking at the value on a book value basis, we see that the current P/B TTM of 2.41 is 150.16% above the sector median of 0.96. But the current P/B is 26.78% less than the five-year average of 3.30.
Quickly looking at the per share for earnings and book value, we can see the values of $2.17 and $13.90, respectively, and when we combine those with their multiples, we arrive at:
- EPS – $2.17 x 22.60 = $49.04
- BVPS – $13.90 x 2.41 = $33.50
All of which the above tells us that on a relative basis, Schwab is either close to fair value or overvalued at the current market price of $49.83.
Now, if we look at the valuation from an intrinsic viewpoint, we see another picture.
Using both the dividend discount model and the excess return model, we see a different scenario. Using the following inputs for both models:
- EPS – $2.17
- Dividend per share – $0.71
- Beta 0.91
- Risk-free rate – 0.85%
- Risk premium – 5.80%
Along with the above inputs, we will also include the:
- Net income – $3,016
- Shareholders’ equity – $31,331
- Return on equity – 13.87%
- Retention ratio – 67.28%
- Estimated growth of 9.33%
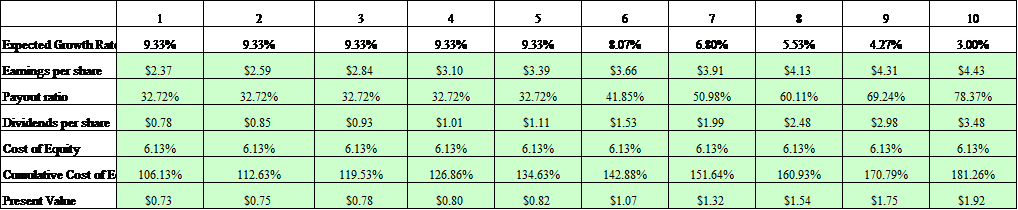
All of which equals a fair value of $74.61.
Now running the same inputs through the excess returns models yields the following result.
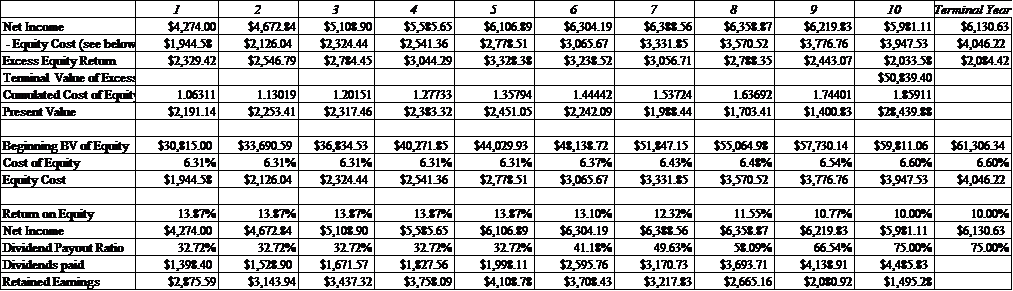
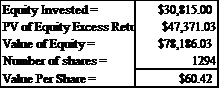
The excess return model gives us a fair value of $60.42, and when we look at both models, we arrive at a fair value between:
- Excess returns – $60.42
- Dividend discount – $74.61
So on an intrinsic value basis, the fair value is between $60 to $74, and based on all the numbers from both the financials and growth prospects, I think a target of $65 is more than fair, and Schwab still has room to grow in the several years. I expect Schwab to compound at 8 to 12% a year based on AUM growth and revenue growth.
Final Thoughts
Schwab has a long history of leading changes in the investment world, starting back in the 1970s with its founding. The company has some good things going for it, with the addition of TD Ameritrade’s AUM and its platform’s improving cost structure.
The other advantage is the bank inside its platform, which allows it to capture additional profits from the customer’s cash balances and the growing loan portfolio. The addition of TD Ameritrades balances will only continue.
The last couple of quarters have been lackluster. Still, the company set itself up for the future TD Ameritrade acquisition and adopted the “newer” business model of forgoing trading fees.
The valuation on an intrinsic basis is attractive, and I think Schwab is a buy into the $65 range; I am long the company, and it was one of my early investments when the market crashed in March.
Another bonus for me is that Schwab is my brokerage of choice as I switched to them in 2019 from then Tradeking, now Ally Invest. The customer service and attention to detail have been superior.
Good luck to all.
