Common sizing, time series, and cross-sectional analysis are fundamental tools for every investor’s toolbox. Both common sizing and time series analysis will help investors understand a business better in terms of profitability, asset and capital needs, as well as spot business trends. Such data can then be used to compare a company to industry competitors in what is referred to as cross-sectional analysis.
Common Sizing Analysis
Many of the metrics that you probably think about already are common sized metrics but you just don’t realize it! Common sizing analysis can be done on both the income statement and the balance sheet by looking at each line item as a percent of the “common” total.
As can be seen below, for the income statement, the total that each line item gets divided into for common sizing is revenue; while for the balance sheet, the total that each line item gets divided into is total assets.


The cash flow statement can also be common sized by dividing items from each section of the cash flow statement (operating, investing, and financing) into the respective total of that specific section.
Common sizing analysis is useful to establish ratios which can then be used to compare against industry competitors (in a cross-sectional analysis), analyze trends (in a time series analysis), as well as create forecast models such as with IFB’s financial model and valuation template.
Once financial statements are represented in a common size format, the dollar amount of the figures no longer cloud the analysis, allowing investors to instead focus on the ratios. Some examples of popular metrics which would be considered common-sized would be gross margins and net income margins on the income statement, as well as the debt-to-asset ratio for the balance sheet.
Vertical vs. Horizontal Common Sizing
The most common type of common sizing analysis, and what we have discussed so far, is referred to as “vertical” common sizing; as we are going up and down each financial statement vertically.
The second type of common sizing that can be done is “horizontal”, where each line item is expressed as a percentage of a base year as we analyze results across the financial statements horizontally. The knowledge gained from horizontal common sizing has a lot of similarities with time series analysis, which is what we will discuss next.

Below is a great example of a horizontal common sizing analysis, where in order to get an idea of how agricultural equipment manufacturer AGCO Corp. is performing compared to the industry, we can compare their revenues to industry leader Deere & Co. over the past decade.
To make dollar figures comparable both companies’ revenues have been laid out in a horizontal common sizing analysis that shows revenue as a percent, with each company’s 2010 revenues acting as the baseline. As can be seen, AGCO Corp.’s revenue declines have been in line with industry leader Deere & Co. and can be attributed to cyclicality in the agriculture industry.

Time Series Analysis
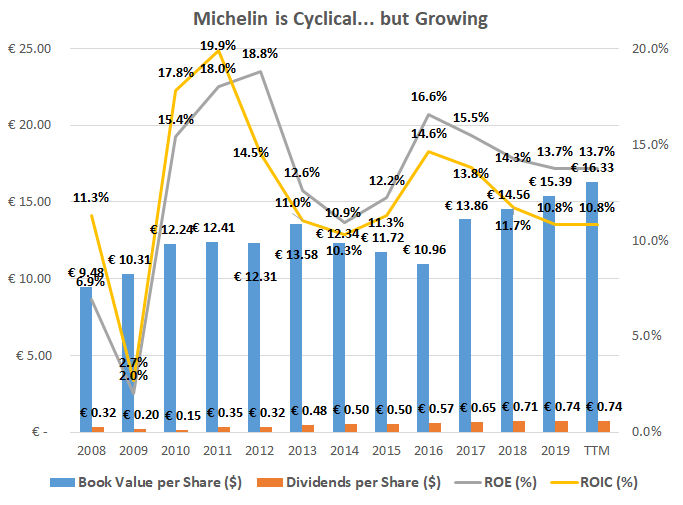
Time series analysis is hugely important in order to identify trends across company financial statements as well as various ratios and metrics. Time series analysis occurs by examining discrete data points listed sequentially, in order of time, and are often best visualized through a line or bar graph.
Below is a time series graph of tire manufacturer Michelin which clearly shows the business’s cyclicality through profitability ratios but also steady growth in dividends and book value.
Trends discovered in time series analysis can then be compared to industry competitors (in a cross-sectional analysis) to understand if the company is gaining or losing ground compared to the competition.
When we talk about time series analysis for a business, the most common time periods to use for external analysts and investors would be years and quarters. For internal management, they might get even more specific with their time series analysis by using months, weeks, or even days to help spot trends and improve their forecasting efforts.
In forecasting models, any trends discovered in time series analysis can be extrapolated into the future if they are expected to continue or can be reversed to the mean, as is necessary for a cyclical business.
Cross-Sectional Analysis
Cross-sectional analysis involves analyzing different data sets for the same metric and time period. In finance, such cross-sectional analysis involves analyzing the financial statements and metrics of different companies for the same time period. This could take the form of many different financial metrics, but the important thing to note is that cross-sectional analysis involves at least two different data sets of the same metric being analyzed for the same time period.
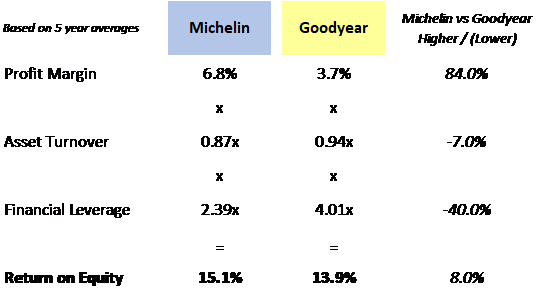
Below is an example of what could be considered a cross-sectional analysis between tire manufacturers Michelin and Good Year as we dissected their return on equity through the DuPont method.
Takeaway for Investors
Being familiar with the different types of data analysis can help investors in their quest to understand a company better and compare it to others in the industry. Knowing which type of analysis you are looking at can help you understand and visualize the data as well as transform the data to suit your needs.
