Contribution margin is used in both investing and management accounting to make decisions regarding profitability, project feasibility, and unit economics. Contribution margin measures the incremental income associated with each additional unit of production. Particularly when investing in growth companies, contribution margin and unit economics should be analyzed very closely to understand the scalability of the business.
This article will explore the concept of contribution margin while also introducing investors to techniques to measure and analyze contribution margin in order to build it into company valuations and forecasts. We will also walk through an example calculating the contribution margin per pint of beer for global brewing giant AB InBev. Readers will be walking away with an understanding (and great bar trivia!) that their next pint of beer might be contributing $0.27 to their preferred brand’s income!
Contribution Margin = Price – Variable Cost
or
Contribution Margin per Unit = Price per Unit– Variable Costs per unit
or
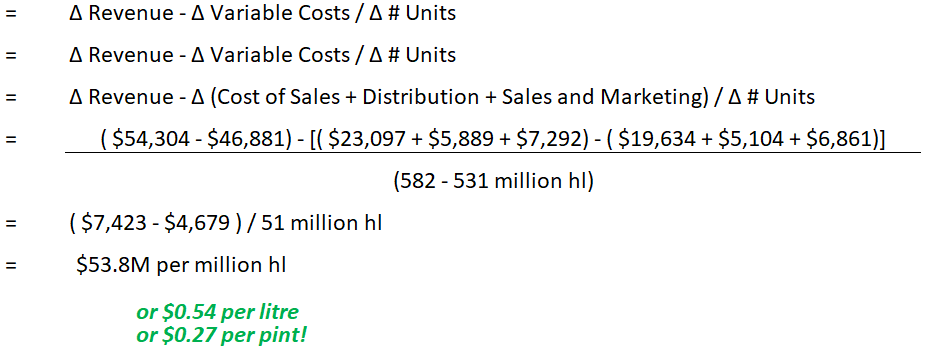
Contribution Margin per Unit = ∆ Revenue – ∆ Variable Costs / ∆ # Units
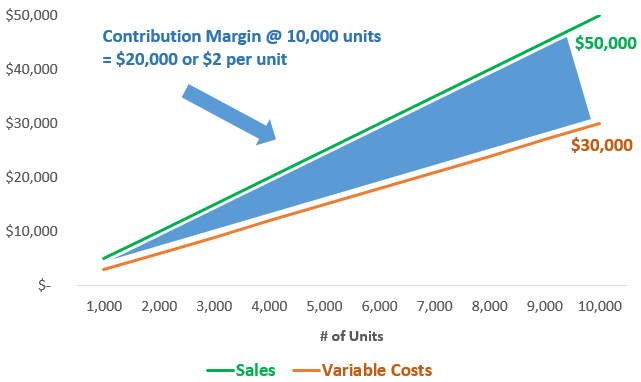
As can be seen in the equation, the incremental contribution margin is taking variable revenue less variable costs. The word “contribution” signifies that we are talking about the incremental income not being consumed by variable unit costs that are “contributing” to covering the fixed costs of the business or project. In our simplified example graphed below, the unit price is $5 and variable costs are $3 per unit. This means that with sales of 10,000 units, revenues will be $50,000 and total variable costs will be $30,000, yielding a net contribution margin of $20,000.
Contribution Margin in Investing
The focus on incremental income means that contribution margin is very similar to net revenue on the income state, which is gross revenue less costs of goods sold. However, in addition to the obvious cost of sales, there are other variable expenses that should be included in the contribution margin calculation. Understanding the concept of contribution margin is useful for investors as it can assist in forecasting net revenue changes as business cycles change and the company grows.
Especially when valuing growth companies, understanding the unit economics through contribution margin analysis can allow investors to appreciate the scalability of the business. A high-growth company with negligible contribution margins is probably not a great investment as that revenue will rarely reach all the way down the income statement to bottom-line net profits. In any breakeven analysis, you will see the calculation for contribution margin is in fact in the numerator of the equation with fixed costs in the denominator. Once again, contribution margin is “contributing” to covering fixed costs.
Calculating Contribution Margin
When measuring the contribution margin for a single product or service, it is important that every single variable cost should be accounted for. Establishing revenue is relatively easy, but determining variable costs can be more difficult.
Below is an outline of what kinds of items go into calculating variable revenue and expenses. As you will see, the variable expenses side is much more nuanced. We will discuss both variable revenue and expenses in more detail and give investors a tip for calculating contribution margin for larger companies.

Variable Revenue
If looking at a company or project with a single product or service, variable revenue will be relatively straightforward. Prices are normally market-based with data available on store websites (for consumer products) or commodity exchanges.
For larger companies, investors will be looking at sales that consist of multiple, if not hundreds, of products. In order to make this reasonable for external investors, they can build a sample contribution margin basket based on the company’s historic or forecasted split across its various product categories or business segments.
Variable Costs
Gaining an understanding of variable expenses per unit can be more difficult than revenues. Internal company management will have a great sense of the multiple variable costs associated with each unit of production, but an external investment analyst or retail investor will have a tougher time given their access to data, or lack thereof. If an investment analyst has a high degree of knowledge about the business (for example an engineer analyzing a mining company), they could have an advantage in estimating variable costs through a bottom-up approach similar to internal management.
For external retail investors, the annual reports and financial statements can be used to build a top-down average contribution margin analysis based on what volume and financial figures are available. Great transparent management might even discuss contribution margins in the management discussion and analysis (MD&A). If contribution margins are not directly discussed by management, in the notes to the financial statements, revenue and margins are broken out by segment as under IFRS a segment is a reportable segment if its reported revenue is 10% or more of the reporting entity’s combined revenue. By measuring the change in a business segment’s volume/revenue and the change in gross margins, we can establish the contribution margin per unit.
Example of Contribution Margin with AB InBev
In this example, we will look at global beer brewing giant AB InBev’s 2021 Annual Report to get a sense of the contribution margin for each litre or pint of beer. The company segments itself geographically so that this analysis could be done for each region. For the purpose of this example, we will stick to the total company’s contribution margin per unit of beer. As you will see below, the company measures its volume in millions of hectolitres (100 litres x 1 million). We can combine the financial data with the volume figures to calculate the average per unit contribution margin.
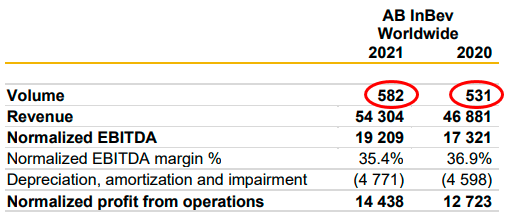
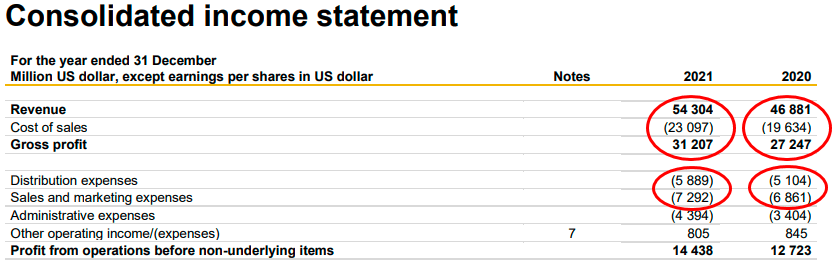
As discussed earlier, the contribution margin calculation is concerned with all variable costs being driven by selling an extra unit of production. This means that for AB InBev’s variable costs, we are including distribution expenses as well as sales and marketing expenses in addition to the obviously variable cost of sales figure. The below contribution margin analysis for AB InBev looks at the change in incremental contribution margin earned given the volume increase from 531 to 582 million hl.
For investors interested in a pre-built financial model where they can punch in the financial data of any company of interest and update for a changing cost of capital, readers can check out our financial model and valuation template called the IFB Equity Model available on our Products page!
Takeaway for Investors
Understanding the concept of contribution margin and unit economics is an important tool for every investor’s toolbox. Particularly when investing in growth companies, contribution margin should be analyzed very closely to understand the scalability of the business. Readers should also remember to whip out the $0.27 per pint beer fact next time they are at the bar or enjoying a tall boy with their friends!
