“Both from the standpoint of stocks and bonds, an investor wants to go where the growth is.”
Bill Gross
Considered the undisputed master of bond investing, Bill Gross spent his entire investing career focusing on the bond asset class and used his main investment vehicle, PIMCO, to generate great wealth for himself and his shareholders over the years. Any ideas he has on bond investing is a must-listen.
Bond investing is one of the great undiscovered territories in the investing world. Did you know that the bond market as of 2019 totaled $102.8 trillion compared to the equity markets of $74.7 trillion? So the global bond market outpaces the global equity markets by two to one, but hardly anyone talks about bonds.
In fact, one of the largest investors in bonds is Warren Buffett! Bet you didn’t know that, huh? All that cash that Buffett is sitting on is in the treasury markets as a way to earn extra money on that money while he waits for opportunities to invest in equities.
Understanding how bonds work and reading a corporate bond yield curve will help you earn the most of any bond investment.
Most investors face the biggest issue when thinking about bonds: what are they, and how do I invest in them? Well, today, you are in luck; we are going to uncover some of those issues.
In today’s post, we will learn:
- What is a Corporate Bond Yield?
- What is a Yield Curve?
- What is the Inverted Yield Curve?
- Impact of the Corporate Bond Yield Curve
Ok, let’s dive in and learn more about the corporate bond yield, the yield curve, and its impacts.
What is a Corporate Bond Yield?
Bond yield is the return investors realize on a bond investment. We can define bond yields in different ways.
Setting the bond yield equal to its coupon rate is the simplest explanation. The current yield of a bond is a function of the bond’s price and the coupon or interest payment. The coupon yield will be more accurate if the bond price is different from its face value or par value.
There are many different, more complex calculations available, but we will focus on some more simple ideas for our methods today.
When thinking about yields and how they work, the simplest idea I have run across is the idea of using a teeter-totter. Think of the rising and falling of the teeter-totter as you push up and down. The bonds yield works in the same manner.
Say you have a bond selling for $1000, and it pays a coupon or interest payment of $100 a year. That equation equals a 10% yield on your investment.
Think of the equation for this yield as:
Coupon Rate = Annual Coupon Payment / Bond Face Value
Coupon Rate = $100 / $1000
Coupon Rate = 10%
Returning to the teeter-totter example, on the left side, we have the annual coupon of $100, and on the right side, we have the par value of the bond of $1000.
As the left side rises and the coupon remains in value at $100, then the price would fall to $900; now returning to our equation, we see:
Coupon Rate = $100 / $900
Coupon Rate = 11.11%
And conversely, as the face value of the bond rises to $1100, the yield on the coupon falls, via:
Coupon Rate = $100 / $1100
Coupon Rate = 9.09%
The bonds’ prices need to adjust to make those investments more attractive to investors to attract investors looking for attractive yields.
Because of how coupons function, remember that once the bond is issued, the coupon’s setting remains fixed until that bond matures.
Likewise, if the company issues a bond with a coupon payment of 7.5% to entice investors, the price of the bond must rise to make it more attractive at that lower yield. So the right side of the teeter-totter rises as the price increases compared to the coupon payment dropping.
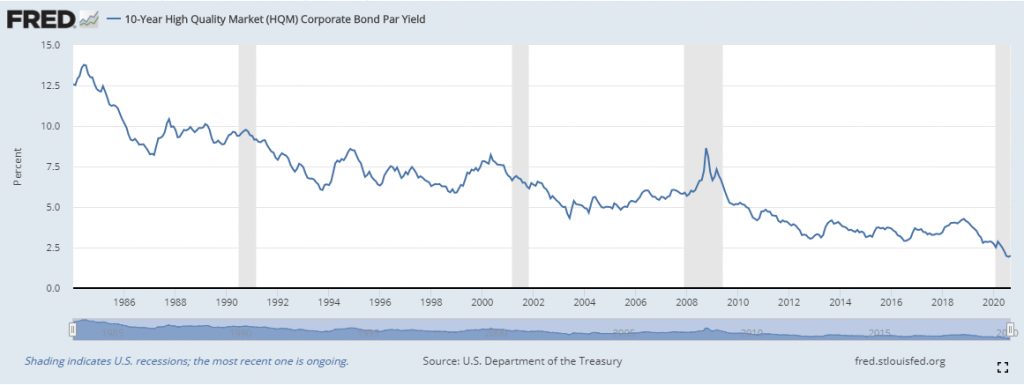
As the interest rates fall, the prices or par value of bonds will rise in correlation. And the same is true in reverse; interest rates rise compared to the falling of bond prices.
In today’s extremely low-interest rates, bond prices are higher than in the recent past, which is needed to entice investors to take on that additional interest rate risk.
What is a Yield Curve?
A yield curve, according to Investopedia:
“A yield curve is a line that plots yields (interest rates) of bonds having equal credit quality but differing maturity dates. The slope of the yield curve gives an idea of future interest rate changes and economic activity. There are three main types of yield curve shapes: normal (upward sloping curve), inverted (downward sloping curve), and flat.”
The yield curve is used as a yardstick for other debt investments in the bond markets. For example, mortgage rates or bank lending rates, plus it, predict changes in the economic output and growth.
Most analysts use the yield curves of three-month, two-year, five-year, ten-year, and 30-year curves of U.S. Treasury debt for comparisons.
Treasury rates are available daily, during business days, at 6 pm every trading day.
A normal yield curve is when the longer maturity bonds have a higher yield than the short-maturity bonds due to the risks related with time.
An inverted yield curve is one in which short-maturity yields are higher than those with longer-term maturities, which many feel is a great indicator of an upcoming recession—more on that in a moment.
In a flat or humpbacked yield curve, the short and longer-term maturities are closer to each other, indicating some economic transition.
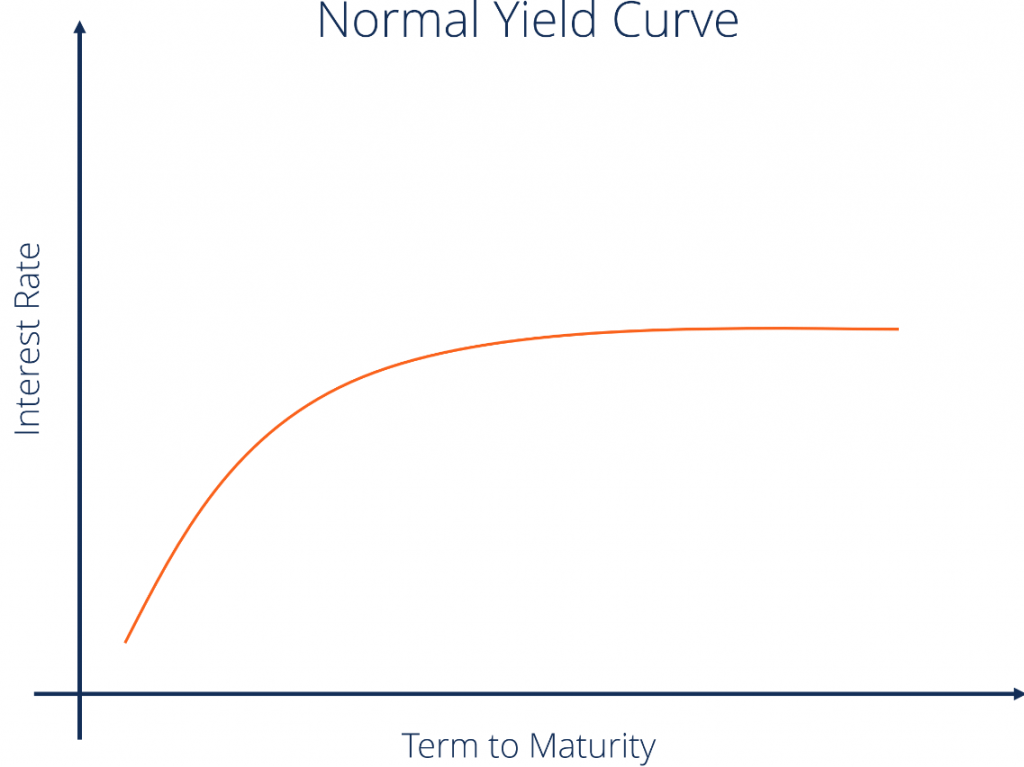
Graph courtesy of corporatefinanceinstitute.com
A normal or up-sloped graph like the one above indicates that the strengthening of bond yields on the longer-term maturities indicates a period of economic expansion.
When investors expect longer-term yields to improve, they might deposit their funds in shorter-term maturities in the expectation that longer-term yields will rise in the future, and offering them the ability to purchase in the coming period.
In rising interest rate environments, it is risky to tie up your investments in longer-term maturities when the value of the bond has yet to decline due to higher yields over time, with the increasing demand for shorter-term bonds pushing their yields even lower, which in turn steepens the up-sloped yield curve.
A flat yield curve may occur when there are changes in economic conditions. When the economy changes from expansion to a slowing economy or even a recession, the yields on longer-term maturities drop, and the yields on short-term bonds rise, changing the normal yield curve to a flat yield curve.
The opposite effect can occur when the inverted yield curve changes to a flat line curve, more on the inverted curve in a couple of sections.
What is the Inverted Yield Curve?
Inverted yield curves indicate a situation where longer-term bonds have lower yields than shorter-term bonds, assuming similar credit ratings.
When the yield curve inverts, typically from a normal, rising yield curve, it indicates that shorter-term rates have risen above longer-term rates.
The inverted yield curve is the rarest of the three curves, and as mentioned previously, is an indicator of a possible recession. Because this type of curve is rare, most of the financial world latches onto its occurrence and assigns it great importance.
Typically, the longer-term rates are higher than shorter-term rates, which is indicated by the rising to the right curves we all associate with growth.
Customarily, an inverted yield curve has preceded recessions in the U.S. Because of this correlation, the yield curve has become a leading indicator of a recession.
But what an inverted yield curve tells us is that most bond investors believe short-term interest rates will fall in the near future.
As we have seen throughout history, recessions usually cause interest rates to fall, and recessions almost always follow inverted yield curves.
To make comparisons simple, most economists usually use a simple spread between two yields to summarize a yield curve.
One of the favorite methods of measuring the yield curve is to use the yields of two-year Treasuries and ten-year Treasuries to determine if the curve is inverted.
The Fed maintains a chart of this spread, and it is updated most days and is one of their most popular data series downloaded.
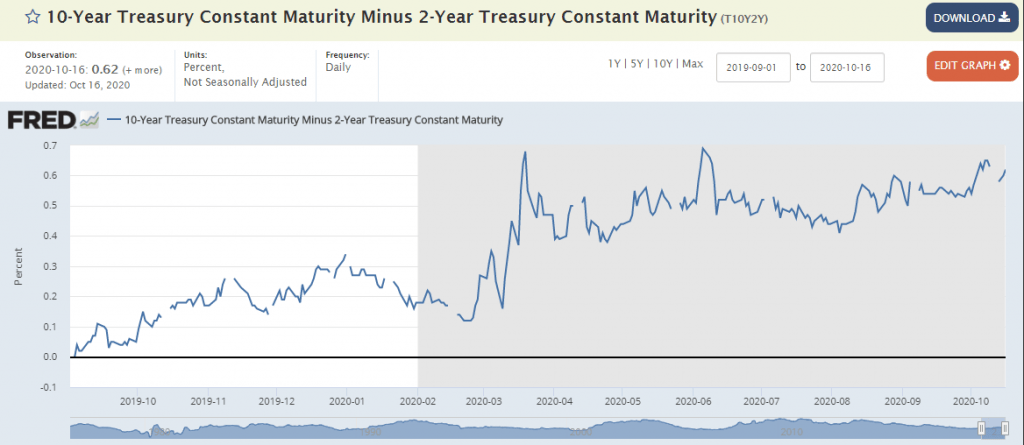
The two-year/ten-year Treasury spread is one of the most reliable leading indicators of a recession within the following years. The Fed has published data since 1976, and for as long as it has published this data, the inverted yield curve has successfully predicted every declared recession in the U.S., without any false signals.
As recently as August 2019, the spread slipped below zero, indicating an inverted yield curve and signaled an economic recession in the U.S. in 2020.
Notice that I highlighted the word, declared. That is because the Fed is the only organization that officially declares a recession, not CNN, Fox News, or the Wall Street Journal. Despite their declarations on the country’s news entering a recession, it is not a fact until the Fed declares that announcement.
With the shape of the current economic recovery up for much debate, whether it is a V-shape or K-shape, it is important to remember that the growth is based on the bond market yields, not the stock market.
Typically the stock market goes up and to the right over the long-term. But the interest rates and the bond markets move in tandem with each other and are more correlated than the stock market.
Understanding that correlation and the impact on the bond markets are indispensable if you want to invest in corporate bonds because the interest rates will drive those bonds’ demand. The more demand rises, the higher yields will rise.
Let’s look at a couple of historical circumstances regarding inverted bond yields.
- In 2006, the yield curve inverted during the year and remained inverted throughout the year. Long-term Treasuries outperformed stocks throughout 2007, and in 2008, long-term Treasuries soared as the stock market crashed. In 2008, the Great Recession had announced its presence with authority, and it turned out to be far worse than expected.
- In 1998, the yield curve shortly inverted for a few weeks. Treasury bond prices jumped after the Russian debt default. The Fed Reserve quickly cut interest rates to help prevent a Recession in the U.S. Many believe that these actions by the Fed precipitated the subsequent dot-com bubble.
Impact of the Corporate Bond Yield Curve
Historically, the inverted yield curve is a leading indicator of a recession, as mentioned previously. When short-term interest rates rise above long-term rates, the market sentiment indicates that the long-term prospects are poor. And that the long-term yields offered for corporate or Treasury bonds will fall.
The inverted yield curve’s long-held view is a leading indicator that is recently coming under more scrutiny. With the rising demand for U.S. Treasuries among foreign purchasers, the U.S. government can offer lower interest rates. Many suggest this indicates that supply and demand are at play instead of more gloomy predictions, such as an impending recession.
A yield curve has the greatest impact on fixed-income investors, particularly corporate bond investors. In normal times, when the yield curve is normal, the long-term investments have higher yields, because the investor is risking their money for longer periods in exchange for the higher yield.
When they happen, an inverted curve offers the shorter-term investor better returns, with the elimination of the risk premium.
When the spread between U.S. Treasuries, considered a risk-free investment, and higher-risk corporate bonds are at historical lows, it is often easier for most to opt for the lower-risk options.
In many cases, buying a U.S. Treasury offers a yield similar to the yields on a junk bond, corporate bond, or REITs, but without the risk associated with those investments.
In the same circumstances, many opt for even money market accounts or CDs as options, especially when those yields pay as much as a 10-year Treasury bond.
Many large corporates are offering up debt to generate capital for growth opportunities, or in some cases, to ensure they make it through these tough economic times.
Below is a smattering of debt offerings from a few S&P 500 companies with their rates and maturity dates.
- Verizon
- 3.25% due in 2026
- 1.38% due in 2026
- 0.88% due in 2027
- Disney
- 1.75% due in 2026
- 2.20% due in 2028
- 3.60% due in 2051
- Johnson & Johnson
- 0.25% due in 2022
- 5.50% due in 2024
- 1.65% due in 2035
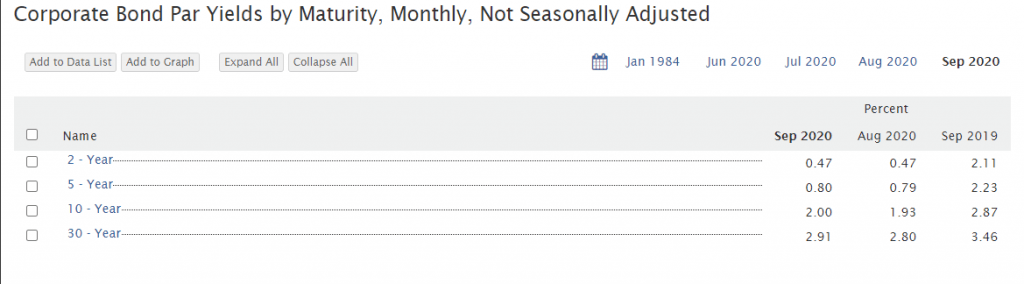
Now, compared the above individual company rates to the overall market, you can see who offers higher yields to attract investors to its bond offerings.
The amount of bond offerings is growing because the interest rates are so low currently, and it offers many companies the ability to borrow money at historical lows, which many companies can use those funds to grow their businesses, even when cash flows are softening.
In many cases, the costs associated with debt offerings or bonds are lower for the company to issue debt than reinvesting its own funds.
Another aspect of the yield curve and any changes that occur is the change in investor sentiment. For example, when the yield curve inverts instead of investing in risky equities, many investors flee either to corporate or Treasury bonds or more defensive type equities.
Defensive stocks, such as food, oil, and tobacco industries, tend to be less sensitive to interest rates, so investing in a company like Walmart is far more attractive when interest rates fall instead of riskier equities.
Final Thoughts
Understanding the yield curve and how it works is crucial for any investor, but especially anyone interested in investing in the debt or bond markets.
Interest rates have an incredible influence on the debt markets and understanding the yield curves and how to read them will hold you in good stead during times of uncertainty.
The basic understanding of higher yields move up and to the right, and lower yields to lower and left is a good place to start with your knowledge of the impact of yield curves.
As the economy moves through its different cycles and the ebb and flow of interest rates, the yield curve will move in a correlation of the different forces moving the interest rates.
Being larger than the equity market, the bond market is far more sensitive to those interest rates. It encourages a much closer inspection of yield curves and an understanding how the data impacts your investments.
Analyzing the corporate bond yield curve before investing in those assets is a great place to start as you decide that those assets might be a good fit for your portfolio. As the corporate bond yield curve improves up and to the right, the returns you receive for your investments will improve.
With that, we are going to wrap up our discussion for today.
As always, thank you for taking the time to read today’s post, and I hope you find something of value on your investing journey.
If I can be of any further assistance, please don’t hesitate to reach out.
Until next time, take care and be safe out there,
Dave
