Updated 12/19/2023
The value of any financial asset is the present value of its future cash flows discounted to the present. That is the basis of any discounted cash flow model and part of valuing any company. Part of that analysis determines the cost of capital or discounting factor of those cash flows.
There are three steps to determining the cost of capital or WACC (weighted average cost of capital), which sets the discount rate for our DCF models:
- Cost of equity
- Cost of debt
- Weightings of each
The cost of equity and debt are parts of companies’ investments to buy assets and grow the business. They can self-finance with free cash flow or use debt or equity to acquire the assets.
Those acquisitions have a cost, and determining the cost of equity is part of determining whether the investment creates or destroys shareholder value. For example, if the cost of equity is 10%, and the return on equity or investment is 12%, then the investment generates value and vice versa.
Understanding the components of the cost of equity and their impacts on valuation will help give you a better understanding of the capital structure and financing decisions, along with a better valuation.
In today’s post, we will learn:
- What is the Cost of Equity?
- The Three Inputs to Calculate the Cost of Equity and How to Find Them
- How to Calculate the Cost of Equity with Examples
Okay, let’s dive in and learn more about the cost of equity formula.
What is the Cost of Equity?
According to the Corporate Finance Institute:
“The cost of equity is the rate of return a company pays out to equity investors. A firm uses the cost of equity to assess the relative attractiveness of investments, including both internal projects and external acquisition opportunities. Companies typically use a combination of equity and debt financing, with equity capital being more expensive.”

Many companies and management use the cost of equity as capital budgeting to establish a required rate of return for capital investments. We can also refer to it as a “hurdle rate” for investments.
Companies raise money from equity investors (selling shares) and lenders (debt) to fund future investments. Both of these investors make their investments expecting to make some return.
Equity investors expect a return in line with investing in stocks with higher returns and risks. These equity investors expect a higher return, which comes as a premium to compensate for the higher risk.
Debt investors have the same expectations of a return and a premium for a possible default on the debt.
These investments comprise the financing a company might use to buy assets to grow, which comprises the cost of capital for a company.
Because the returns for stocks remain higher, it stands to reason that the cost of equity is higher than debt.
First, equity shareholders have a junior claim on the value of a company versus the debt shareholders. So, if something goes sideways, debt holders get paid first, and equity shareholders receive what is left.
Another bonus for debt shareholders is that interest expense is tax-deductible, helping further reduce the cost of debt.
Pro tip: your cost of equity should NEVER be below your cost of debt.
Another pro tip: if you are discounting cash flows to equity, use the cost of equity as your discount rate. If you are discounting cash flows to the firm, the appropriate discount rate is the cost of capital.
The Three Inputs to Calculate the Cost of Equity and Where to Find Them
The classic way to calculate the equity cost is using the CAPM formula or Capital Asset Pricing Model. The Fama-French Three-Factor model and arbitrage pricing theory (APT) are other ways to calculate it.

However, because the CAPM model is the most common example, we will use it as our primary focus.
The CAPM model, per Michael Maubousssin:
“The CAPM says that the expected return on a security is the risk-free rate plus the security’s beta times the equity risk premium (i.e., the difference between the market return and the risk-free rate).”
Where the model is:
CAPM = Risk-free rate + Beta(equity risk premium)
To put the cost of equity model to its best use, we need to determine three inputs:
- What is the risk-free rate?
- How do I estimate the equity risk premium?
- What is the best way to estimate beta?
Risk-Free Rate
The risk-free rate is by far the simplest input to determine. On a risk-free investment, the actual return matches the expected return.
For an investment to be risk-free, it must have:
- No default risk
- No reinvestment risk
So, to determine the risk-free rate, we need to determine:
- How long is the cash flow time horizon, and how long will the investment last?
- Each risk-free rate is currency-specific and can vary wildly for different currencies.
- Unfortunately, not all government securities are risk-free, with some governments facing default risk, and their bond rates will not be risk-free.
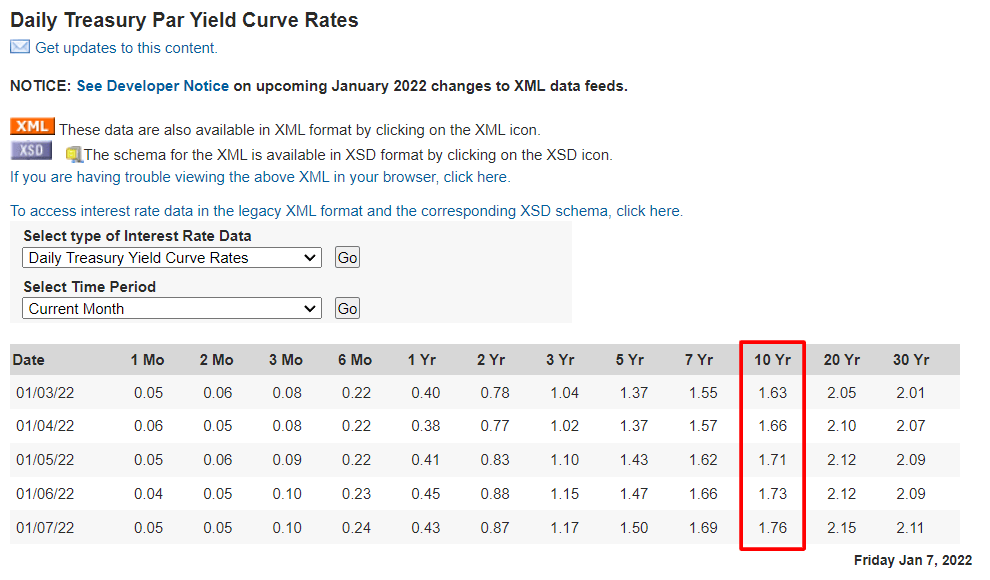
For investors in the US or those investing in US stocks, the best proxy for a risk-free rate is the 10-year Treasury note. The 10-year yield is easy to find, is long-dated, and has relatively low risk.
The quickest and easiest place to find the most up-to-date 10-year Treasury rate is:
Daily Treasury Par Yield Curve Rates
Below is an example of a screenshot of what the pages look like when you look for the 10-year Treasury rate.
Outside of the US, it is a little trickier, but luckily for us, Professor Aswath Damodaran, professor of finance at NYU Stern, shares these estimates on his website in local currencies.
Getting to a risk-free rate in a currency uses a combination of local government rate bonds and government bond spread.
For example, the Brazilian government bond rate in reais (Brazilian currency) on January 1, 2021, was 16.51%, based on Damodaran’s bond spread of 4.83% over the US treasury bond rate, we get:
Risk-free rate in reais = 16.51% – 4.83% = 11.32%
Simple, huh?
It gets easier with time and more practice.
Equity Risk Premium
The equity risk premium differs between the expected market return and the risk-free asset. The idea behind the equity risk premium or ERP is straightforward: most investors are risk-averse and demand a higher return for riskier investments than less risky investments.
The challenge is to estimate the premium, which is no easy task, but luckily for us, Professor Damodaran calculates the ERP for each country at the beginning of each calendar year. It is a rite of passage for the New Year, so follow this link to find the ERP for any country.
Risk Premiums For the US and Other Markets
Based on a recent paper by Professor Damodaran, the range of equity risk premiums is between 1.7% and 7.7%, depending on the appropriate risk-free rate and the historical period you study.
Damodaran posts his calculations for the equity risk premium on the website, which you can find here.
Since 2008, the ERP in the US has ranged between 4 and 8 percent, and at current levels, it is 4.24%.
Beta
The measure of risk in the cost of equity formula is beta. Beta is a measure of risk calculated compared to the regression of the company’s stock price. Generally, the higher the volatility, the higher the beta and risk relative to the overall market.

For example, a company with a beta of 0.71 is less risky than a company with a beta of 1.52.
Beta is controversial, and many investors, educators, and professionals consider it a mixed bag as a measure of risk.
As with any calculation or metric, it is not without its fault, but as Professors Damodaran and Mauboussin advocate for its use as a measure of risk, that is good enough for me.
Using all of these inputs is to find a cost of equity that makes sense on a business, economic, and common-sense basis.
There are two things we need to remember about the beta:
- Beta measures the risk a company adds to a diversified portfolio. That means a particular company might carry high individual risk but low portfolio risk, and vice versa.
- Beta measures relative risk, with an average of 1.0.
The mathematical definition of beta is a little more complex than I want to dwell on. Still, for now, we can determine a company’s beta by accessing the information from a variety of sources, such as:
- Seeking Alpha
- Gurufocus
- Morningstar
A great idea to get the “best” beta is to use several sources, whether you calculate yourself or the website, and use the average of beta, for example:
Google Beta | |
Seeking Alpha (2 years) | 1.01 |
Gurufocus | 1 |
Morningstar (5-year) | 1.06 |
Average | 1.02 |
Using the average and a mix of short and long-term betas will get a nice range of numbers and a little more stable beta for our cost of equity formula.
How To Calculate Cost of Equity With Examples
Now that we understand the different components of the cost of equity and how to find these numbers, let’s look at calculating a few costs of equity with different companies to handle this important formula.

To remind you, the cost of equity formula is:
Cost of Equity = Risk-free rate + Beta(Equity Risk Premium)
The first company I would like to explore is Google (GOOG).
The current risk-free rate is 1.76%; per the US Treasury website, we will use this risk-free rate for all of our calculations with US companies.
Next up is the equity risk premium. According to Professor Damodaran’s website, as of January 1, 2022, the current rate is 4.90%, which we will use for all US companies.
The last inputs are beta, and after consulting with the three websites mentioned above, we found the following:
- Seeking Alpha (2-year) = 1.01
- Gurufocus = 1
- Morningstar (5-year) = 1.06
- Average = 1.02
Now, plugging the above inputs into the cost of equity formula, we see the cost of equity for Google:
Cost of Equity = 1.76% + 1.02(4.90%) = 6.76%
Simple, huh?
If we compare that to Google’s return on equity, we see a rate of 30.77%, which indicates that Google is earning great returns on the company’s equity.
Let’s try this with a few more, shall we?
Walmart (WMT) will be our next guinea pig, and since we already know the risk-free rate and equity risk premium, we only need to determine the beta for Walmart.
Walmart’s current beta is:
- Seeking Alpha = 0.51
- Gurufocus = 0.46
- Morningstar = 0.51
- Average = 0.49
Cost of equity for Walmart = 1.76% + 0.49(4.90%) = 4.16%
And going further, comparing it to the current cost of equity for Walmart, we see a rate of 9.94%. That again indicates Walmart creates value from its equity for shareholders.
Both companies are fairly stable; let’s look at a few that are less stable; for these, I will determine the average beta and plug them into the formula.
Company | Risk-Free Rate | Beta | ERP | Cost of Equity | Return on Equity |
Tesla | 1.76% | 1.94 | 4.90% | 11.27% | 15.34% |
PayPal | 1.76% | 1.19 | 4.90% | 7.59% | 24.45% |
Square | 1.76% | 1.96 | 4.90% | 11.36 | 21.07% |
AMD | 1.76% | 1.45 | 4.90% | 8.87% | 65.23% |
Peloton | 1.76% | 0 | 4.90% | 1.76% | -35.3% |
The chart above is a great illustration of the impact of market volatility, along with the perceived risk of owning companies like Tesla or Square. Both companies are earning returns on equity greater than their costs of equity, which is good.
But the chart also outlines the impact or importance of interest rates.
For example, as the Fed raises interest rates, the risk-free rate and equity risk premium will rise, driving up the cost of equity.
That is one of the ways that interest rates impact stock investing; as the rates increase, the hurdle rate or discount rate will grow, driving down valuations. Because as the discount rates grow, the current value of the future cash flows decreases, driving down the future values of the company.
For example, let’s say that the interest rates drive up the risk-free rate to 2.5% and equity risk premium to 6%, rates seen not that long ago, before COVID-19.
The cost of equity, for Walmart, if the rates increased that much, would give the company a cost of equity of:
Walmart cost of equity = 2.5% + 0.49(6%) = 5.44%
Still far less than its return on equity, but if we look at the same rate for Tesla, we see:
Tesla cost of equity = 2.5% + 1.94 (6%) = 14.14%
That cost of equity is far closer to the return on equity for Tesla, telling investors that Tesla’s valuation might suffer if interest rates rise.
Final Thoughts
The cost of equity formula helps us determine the value of a company’s equity investments compared to the company’s returns on that equity.
The greater the spread between the two, the more profitable the company is for shareholders.
One of the company’s primary jobs, maybe its only job, is to grow shareholder value. Finding and executing projects or plans that exceed the cost of those investments, either equity or debt, is job number one.
The chart above helps illustrate the impact of volatility, risk, and the potential rise in interest rates.
A great practice when valuing a company is building adjusted interest rates, especially in an environment where you think those rate increases are inevitable.
For younger or riskier companies, the impact of higher interest rates on the cost of equity can be tremendous, as we observed with the Tesla example.
The cost of equity formula is simple math. Once you understand the reasoning behind the formula, find the inputs, and think about long-term impacts, you can easily calculate any company’s equity cost.
Again, the resources for calculating the inputs are:
Risk-free rate: Treasury.gov
Equity Risk Premium: Damodaran.com
Beta: SeekingAlpha.com
Beta: Gurufocus.com
Beta: Morningstar.com
If you want a deeper dive into the math behind betas, equity risk premiums, and more, check out these resources:
Estimating the Cost of Capital
Weighted Average Cost of Capital Tutorial
And with that, we will wrap up our discussion on the cost of equity formula.
As always, thank you for taking the time to read today’s post, and I hope you find some value. If I can further assist, please don’t hesitate to reach out.
Until next time, take care and be safe out there,
Dave

Dave Ahern
Dave, a self-taught investor, empowers investors to start investing by demystifying the stock market.
