Darden Restaurant Inc 10Q Summary
Darden Restaurants. Inc (DRI) reported its financial results of the third quarter of 2020 on February 23, 2020. The following report is a summary of those results and will offer no commentary on the results, just the facts, as reported by Darden Restaurants. Inc. For more detail, please access the 10Q for Darden Restaurants below
Darden Restaurants 10Q Third Quarter 2020
Overview of Numbers for Third Quarter 2020
- Month End Stock Price – $97.50
- Quarter End Market Cap – $11.97 Billion
- Earnings Per Share – $1.89
- Book Value Per Share – $19.07
- Return on Equity – 40.27%
- Return on Assets – 9.43%
- Return on Invested Capital – 9.51%
- Debt to Equity Ratio – 2.24
- Dividends Per Share – $0.88
- Dividend Payout Ratio – 46%
Third Quarter 2020 Financial Highlights:
All comparisons are versus the related quarter from the previous year.
- Darden Restaurants’ total sales increased by 4.5% to $2.35 billion, a result of 40 new restaurants coming online during the quarter, and a same-restaurant sales increase of 2.3% for the quarter.
- Comp restaurant sales by brand:
- Olive Garden – 2.1%
- LongHorn Steakhouse – 3.9%
- Capital Grille – 4.2%
- Eddie V’s – 3.9%
- Cheddar’s Scratch Kitchen – (1.6%)
- Yard House – 1.8%
- Seasons 52 – 3%
- Bahama Breeze – (0.5%)
- Darden Restaurants reported diluted net earnings per share increase of 5.6% to $1.90, comparing to the year-ago quarter of 2019.
- Stock repurchases for Darden Restaurants of 0.6 million shares for a total of $69 million approximately. So far, this fiscal year, Darden Restaurants has repurchased 2.6 million shares for approximately $300 million, with a remaining $321 million available under the current repurchase agreement of $500 million.
Segment Performance
The segment profit below represents sales, minus costs for food and beverage, restaurant labor, expenses and, marketing expenses.
Sales by segment:
2020 2019 %Change
Darden Restaurants $2,346.15 $2,246.5 4.5%
Olive Garden $1,169.3 $1,130.2 3.5%
Longhorn Steakhouse $510.7 $483.2 5.7%
Fine Dining $188.4 $174.5 8.0%
Other Business $478.1 $458.6 4.3%
Profit by Segment:
Olive Garden $246.7 $245.6 0.4%
Longhorn Steakhouse $104.6 $97.3 7.5%
Fine Dining $188.4 $174.5 7.6%
Other Business $69.5 $69.2 0.4%
U.S. Comp Restaurant Sales Results:
Olive Garden Comp Results for the Quarter
- Sales – 2.1%
- Traffic – 0.2%
- Pricing – 1.8%
- Menu-mix – 0.1%
Longhorn Steakhouse Comp Results for the Quarter
- Sales – 3.9%
- Traffic – 1.6%
- Pricing – 1.9%
- Menu-mix – 0.4%
Financial Highlights for the Third Quarter 2020
Sales
Olive Garden saw sales increases in the third quarter as a result of comp sales increases and the growth of new stores coming online. The comp sales for the same stores increased by 1.9% as a result of an increase in check averages and growth in traffic of 0.2%.
Likewise, LongHorn Steakhouses increased same-store sales as a result of comp sales increase and new restaurants coming online. Comp sales rose as a result of increases in check average of 2.3% and a 1.6% increase in traffic.
The results for the other brands such as Cheddar’s Scratch Kitchen, Yard House, The Capital Grille, Season 52, Bahama Breeze, and Eddie V’s generated sales increases 5.8% combined for the quarter, increases attributed to new store sales. The brand’s Cheddar’s Scratch Kitchen and Bahama Breeze recorded comp sales declines for the quarter, with the other brands offsetting the losses by showing comp sales increases.
Costs and Expenses
Food and beverage costs declined as a percentage of sales by 1% for the quarter as a result of pricing and cost initiatives, all of which was offset by an unfavorable menu-mix.
Labor for the restaurants increased 1.3% for the quarter compared to sales, attributed to inflation and offset by price leverage.
Increased media spending for the Olive Garden and Cheddar’s Scratch Kitchen drove an increase in marketing expenses compared to sales.
Also, general and administrative expenses declined due to sales leverage compared to sales.
Taxes
Darden Restaurants reported a tax rate of 12% for the quarter, an increase over the 11% tax rate reported for the year-ago quarter.
Segment Results
Olive Garden saw a decline in segment profit as a result of increased labor costs partially because of inflation and increases in tv media marketing expenses.
LongHorn Steakhouses increased its profit margin as a result of positive same-store comp sales.
The Fine Dining segment observed a decrease in segment profit margin driven by inefficiencies in new store labor results and pre-opening expenses. The Other Business segment also saw a decrease in the profit margin as a result of marketing expenses, and a decline in comp sales for Cheddar’s Scratch Kitchen and Bahama Breeze.
Liquidity and Capital Resources
Typically, Darden Restaurants uses the cash flow generated from operations to cover expenses and costs for the restaurant. With the onset of Covid-19 and the impact on the business, the company drew down on a revolving credit agreement to the tune of $750 million. The drawdown was done to maintain liquidity and ensure that operations could continue.
The bonds of the company are currently rated:
| Moody’s Investors Service “Baa3”; |
| Standard & Poor’s “BBB”Fitch “BBB” Outstanding long-term debt from the 10Q: • $500.0 million of unsecured 3.850 percent senior notes due in May 2027; • $96.3 million of unsecured 6.000 percent senior notes due in August 2035; • $42.8 million of unsecured 6.800 percent senior notes due in October 2037; and • $300.0 million of unsecured 4.550 percent senior notes due in February 2048 |
The interest rate on the company’s $42.8 billion senior notes is due in 2037.
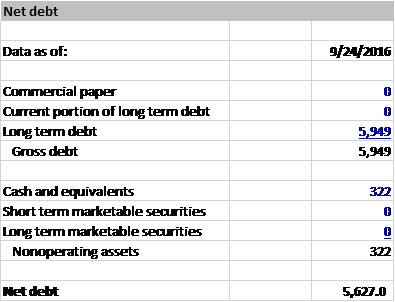
Darden Restaurants reported total current assets of $686 million as of the third quarter and total liabilities $1.68 billion.
Finally, the company announced recently that the dividend would be suspended for the upcoming quarter and reassessed going forward; also, the share repurchase program is currently suspended.
Valuation
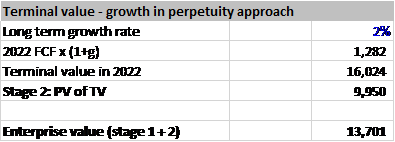
In this section, I will present a discounted cash flow valuation of Darden Restaurants, Inc. The valuation is based on current information and will be based on the trailing twelve-month numbers. I will show my assumptions along with the results so you can see the logic as it follows through the model.
Growth Rate of Cash Flows: 10%
Discount Rate: 10%
Terminal Rate: 2%

Comparable discount rates, with all others staying the same:
9% – $82.51
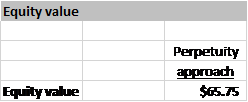
10% – $65.75
11% – $52.73
Final Thoughts
With that, it wraps up our summary of the third quarter results of Darden Restaurants. Inc. There have been no opinions offered, and the evaluation is meant as an exercise to find a price for a possilble investment. It is not meant as investment advice or guidance. If you are interested in buying or selling shares of Darden, please do your due diligence before acting on those thoughts.
Thanks for reading, and until next time.
Take care and be safe out there,
Dave
