Updated: 5/22/2023
Days Sales in Inventory, or DSI, can a great ratio to evaluate inventory management. It can also sometimes signal future demand (and thus revenue) problems in advance.
In this post, we’ll discuss:
- The Days Sales in Inventory (DSI) calculation
- Examples of bad DSI trends
- Best applications of the Days Sales in Inventory ratio
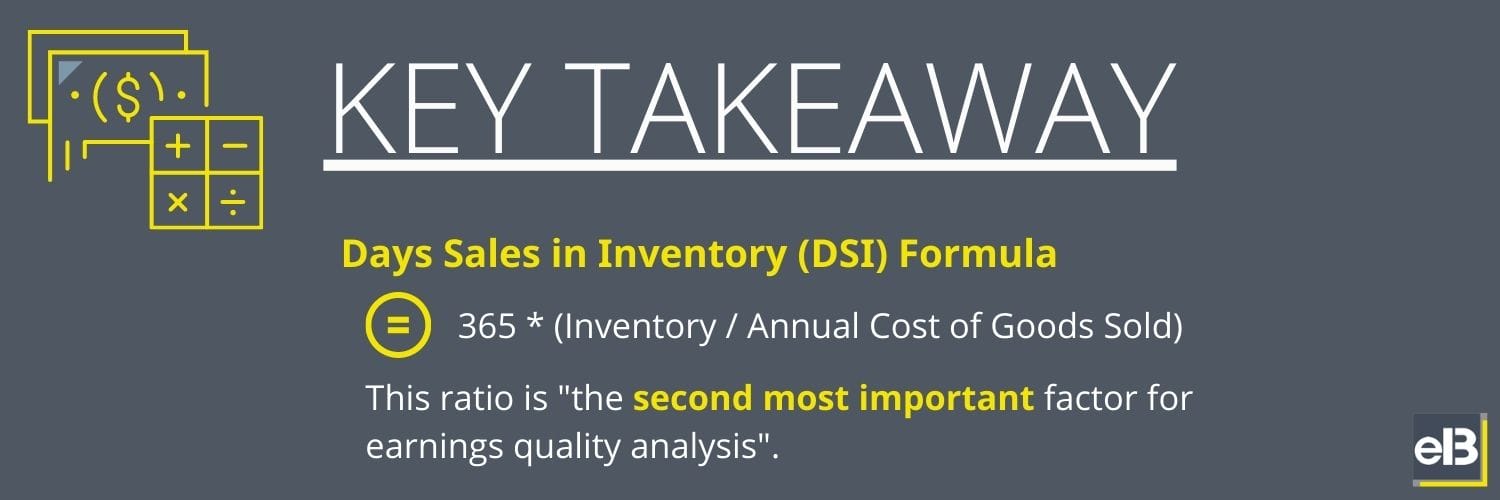
Let’s dive in to what stock shorting specialist John Del Vecchio, CFA called “the second most important factor for earnings quality analysis”—the number #1 being Revenue Recognition (with another great ratio for evaluating that called (DSO or Days Sales Outstanding).
How to Calculate Days Sales in Inventory
Not all inventory is created equal.
Depending on the business model, inventory can either (mostly) hold its value over time or not. In the case that a company is in an industry where inventory quickly becomes obsolete, evaluating inventory management can be a critical component of evaluating management’s capital allocation skills.
A great way to evaluate inventory management is through trends in Days Sales in Inventory.
A rising DSI inventory ratio could indicate either (or both) falling demand for a company’s products or a poor reading by management of future demand (leading to inventory write downs).
In a similar vein, a falling DSI inventory ratio could indicate either (or both) insatiable demand for a company’s products or, again, poor reading of management of future demand (leading to missed opportunities for revenue due to inventory shortages).
The Days Sales in Inventory calculation itself is simple:
Quarterly DSI = 91.25 * (Inventory / Quarterly Cost of Goods Sold)
The version for the annual version is the same except for minor changes:
Annual DSI = 365 * (Inventory / Annual Cost of Goods Sold)
Tracking the change in Days Sales in Inventory over time is the best way to use this formula, while also combining it with observations of management’s comments about it (usually in the 10-k footnotes) and its context in the financial statements.
Examples of Bad DSI Trends
I’m not going to re-invent the wheel with these examples, as John Del Vecchio, CFA provided fantastic examples of Days Sales in Inventory highlighting aggressive inventory management in his fantastic book called What’s Behind the Numbers.
Crocs
The first example was a company called Crocs, a manufacturer of trendy shoes.
John noted that from Q3 2007 into Q1 2008, Days Sales in Inventory exploded higher vs revenue growth, and then fell off a cliff in the other direction shortly after.
It was indicative of an overinvestment in inventory, followed by a heavy bloating of inventory when demand did not keep up with this investment.
Maxim Integrated
Another fantastic example was Maxim Integrated in 2005.
The stock went from the $38 range to the $30 range (-20%), and then kept falling to $13.73 by late 2008 (after a short NASDAQ delisting journey in between).
In summation, die-bank inventory DSI grew 46 days YOY in the March 2005 quarter. At the same time, competitor Linear Technology only had die-bank inventory DSI of 53 days compared to Maxim Integrated’s appalling 130 days.
In prescient fashion, John outlined exactly why this concerning trend for the company could be a death sentence (bolded emphasis mine):
“We also believe that these high inventories threaten continued production at current rates. Given that depreciation is nearly half the cost of goods sold for Maxim, spreading that high fixed cost over lower output would dramatically reduce gross margin. As a result, we think the high gross margins and inventory levels augur Maxim’s future earnings disappointment.”
Maxim was trading at $38.83 when John wrote this. As I mentioned already, the stock fell off a cliff shortly after.
Best applications of the Days Sales in Inventory Ratio
In short, the DSI inventory calculation is generally of supreme importance for business models in industries with fickle demand.
Thornton O’glove quantified a few industries that adeptly represent those situations in his book Quality of Earnings, such as:
- High fashion
- Seasonal goods
- High tech
But any company with recorded inventory on the balance sheet could really experience similar trends. That’s why a basic understanding of Days Sales in Inventory can be a valuable tool in spotting concerning inventory management trends as you look through financials.
Another great use of Days Sales in Inventory in through a breakdown of inventory components. You can replace Inventory in the DSI calculation with each of:
- Raw Materials
- Work in Process
- Finished Goods
You’ll see the breakdown between these major types of inventory in some companies’ footnotes to the financials, especially where either raw materials make up a significant component and/or lead times for production are generally long (think semiconductors).
In fact, let’s take an example comparison of 2 semiconductor companies who lay out their Inventory Components individually, and calculate Days Sales in Inventory for each.
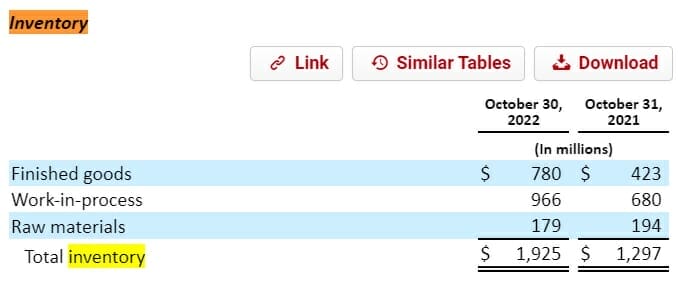
Taking the latest 10-k for Broadcom ($AVGO), use the search (“Ctrl+f”) function on the keyword “inventory” to see the following breakdown in notes to the financials:
We could use these data points to calculate a long term trend in DSI, and subsequently monitor DSI as the company releases quarterly earnings to quickly spot potential trouble ahead.
Here’s a sample 2022 Days Sales in Inventory calculation for each (noting that Cost of Goods Sold for 2022 was $11,108 million):
- Days Sales in Raw Materials = 365 * (179 / 11,108) = 6 days
- Days Sales in Work in Process = 365 * (966 / 11,108) = 32 days
- Days Sales in Finished Goods = 365 * (780 / 11,108) = 26 days
Let’s now take competitor Qualcomm ($QCOM) for a potential “apples-to-apples” comparison. From their latest 10-k:
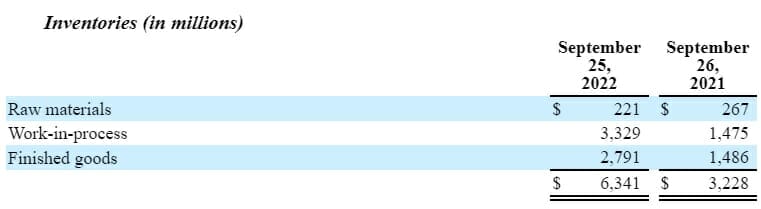
- Days Sales in Raw Materials = 4 days
- Days Sales in Work in Process = 65 days
- Days Sales in Finished Goods = 55 days
Notice the much higher DSI for Work in Process and Finished Goods for QCOM vs Broadcom. Looking at the changes in DSI over time is another way to get great context on the formula.
Investor Takeaway
When you really start to embark on deep company analysis as you dissect a 10-k and other features of a business, there will be small details that can tell a big picture on the performance of a business.
The Days Sales in Inventory ratio can be a great way to capture that sort of an indication, and should be a key ratio to monitor for businesses with potential for inventory to quickly become obsolete.
Not every business will have this feature, but watch for things such as large depreciation as a percentage of cost of goods and/or large additions or subtractions to operating cash flows in the inventory line-item of the cash flow statement.

Andrew Sather
Andrew has always believed that average investors have so much potential to build wealth, through the power of patience, a long-term mindset, and compound interest.
