Yeah, I said it – DCA investing is actually going to hurt your returns. And honestly, I feel like it’s really not even that much of a hot take when it really boils down to it.
The biggest thing that I see with people that argue for DCA investing is that their definition of DCA investing actually isn’t what DCA investing is. Let me explain.

The definition that Investopedia gives is, “Dollar-cost averaging (DCA) is an investment strategy in which an investor divides up the total amount to be invested across periodic purchases of a target asset in an effort to reduce the impact of volatility on the overall purchase.”
When it comes to investing, you really have two different options – DCA investing or lump sum investing. Lump sum investing is self-explanatory where you will simply invest all of your money at the same time in one lump sum.
A lot of people will say they DCA invest because they take XXX from every paycheck and then put it into the market, but I actually would argue that this is not DCA investing but lump sum investing. Let me give some examples to help differentiate the two even more.
- You receive an inheritance for $12K
- DCA Investing – you invest $1K each month over the course of a year
- Lump Sum Investing – you invest $12K in one lump sum
- You save $100/month for investing:
- DCA Investing – you invest $25/week until the next month where you get another $100
- Lump Sum Investing – you invest $100 in one lump sum
Make sense? In essence, lump sum investing is just investing all that you have while DCA investing is purposefully holding onto some cash that you have to invest it at a later point in time.
I get paid biweekly and that’s when my money is put into my investing accounts, and when it is, I lump sum that into my holdings, or maybe a new stock that I’ve found, but I would never hold onto some of it to invest later (unless I didn’t have any stocks that I thought were great values, and even then I’d likely put it into an S&P 500 ETF until I found a good company).
I want to be very clear and say that I strongly support you investing XXX from every paycheck at a regular interval. I think that’s one of the best ways that someone can invest by making it a ratable amount at a ratable date. It’s great for your budget planning, budget calendar, and keeps you from getting in the way and making the choice to “skip a contribution” to go buy a TV or an Xbox or something.
I am just saying that taking XXX from every paycheck isn’t DCA investing. It’s not. It’s biweekly lump sum investing or insert whatever frequency that you get paid.
Do you know why I wouldn’t utilize DCA investing?
The answer is very simple, honestly.
On average, over time, the stock market goes up 10% each year. Sure, I might be investing at the top of the market, but I also might be investing at the very bottom. I can certainly take my biweekly contribution and even split it in half to do 50% the day I get paid and 50% the next week, but on average, I’m going to be investing at a higher price than if I just invested it all when I got paid.
But don’t just take my word for it – let’s look at the real-life math.
I went back and ran the numbers on how your returns would look comparing DCA vs. Lump Sum Investing into the S&P 500 since 1/1/1985 for a full 35 years of data. I assumed the following when running my scenario:
- Lump Sum Investing – you invest $12K the first trading day of each calendar year and let it sit
- DCA – you evenly distribute your $12K into 12 different contributions and invest $1K the first trading day of each month
As I mentioned, I simply compared this to investing into the S&P 500 since 1985 to get a view of the total stock market.
What do you think happened?
You might be able to guess, but DCA investing won! JK – it definitely did not.
Lump sum investing won a vast majority of the time over DCA. In essence, since the price at the end of the day is the same ($380.36 for the SPY ETF as of 2/28/21), all that really matters is the number of shares that were able to be bought throughout the year.
The chart below shows the total amount of shares that were able to be purchased, by year, using these two strategies:
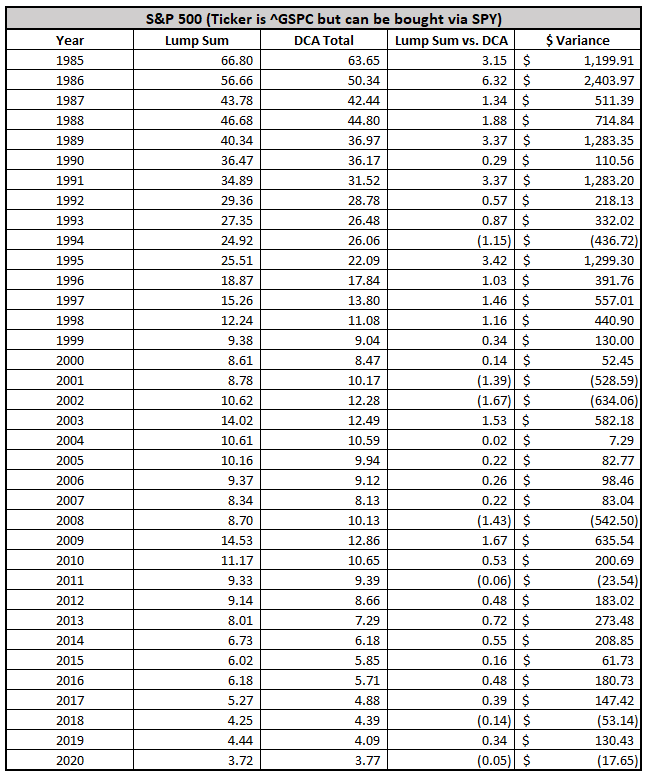
The second furthest column to the right shows the number of shares that you were able to purchase utilizing lump sum investing over DCA. For instance, in 1985 you would’ve been able to purchase 3.15 more shares utilizing lump sum investing by purchasing the first trading day of the year than you would’ve been able to if you purchased them ratably throughout the year.
It’s a lot of information to digest so let’s take a look at all of the years that Lump Sum investing outperformed DCA, ranked in order of the largest year of outperformance to the least:
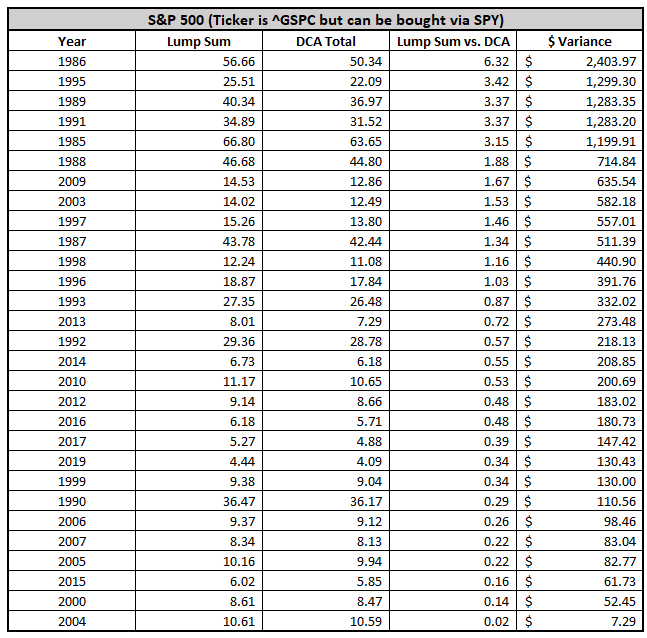
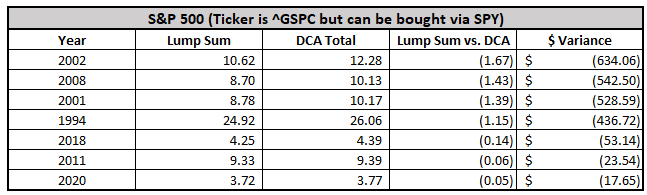
Wow – that’s quite a few years!! In fact, it’s 28/35 years, or 80% of the total amount of time that Lump Sum investing won out. Which means that DCA investing only outperformed in 7 years, or 20% of the time:
Pretty eye opening, right? I know it certainly was eye opening for me when I saw this. One thing that I always like to do in my analysis is get a few different metrics just to see how things have fared in that time period. Below shows the average, median, max and min difference when comparing the S&P 500 of lump sum investing vs. DCA investing over these 35 years:
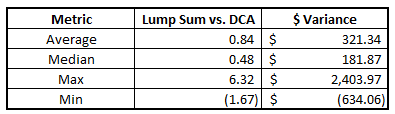
What this tells me is that the benefit is very clearly favoring Lump Sum investing. The average and the median are in favor of lump sum by about .75 shares and then the max/min comparison is heavily skewed towards benefiting the lump sum as well.
In general, this would make me definitely want to side on the lump sum option. But this is merely only one comparison of one stock market index. To drive down even a little bit further, I wanted to take a look at how two different stocks have compared since 1985 – Apple (AAPL) & General Electric (GE).
Apple is one of the most consistent, best performing companies that we have all likely experienced in our lifetimes. Take a look at their stock chart below since 1985:
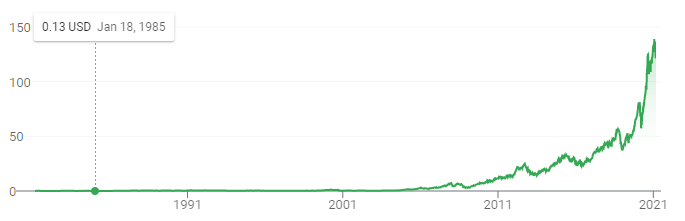
Now while it was relatively flat basically until the mid-2000’s, this shows the importance of investing in companies for the long-term because their shares went from $.50 to being currently at $121.26, and that’s not including the tons of stock splits that they have done and also their dividend performance.
When I do the same analysis that I did for the S&P 500, I get the following results:

A lot of the earlier years were all really major swings because the number of shares you could buy were so drastically different from year to year because the share price was well under $1. Because of that, it’s almost irrelevant to even look at the data pre-2000 when comparing this.
Below is the chart showing all of the years that DCA investing outperformed Lump Sum investing:
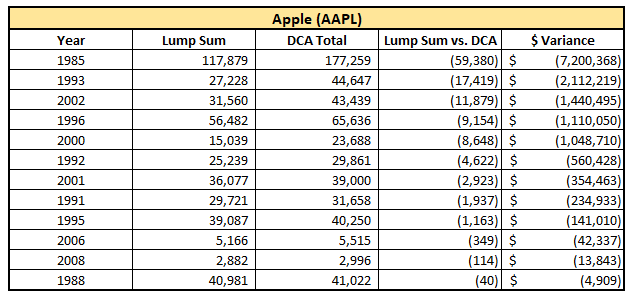
12/35 years were better off for DCA investing but 7 of those 12 came before 2000, so you can honestly almost throw those out in a way. When you look at the years that Lump Sum Investing beat out DCA investing, the amount is staggering!

Obviously, there are many more years and the amounts are quite large, even in the relatively recent years that are post-2000.
In total, you can see that my same few metrics once again will strongly prefer the Lump Sum investing:
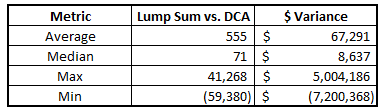
On a side note, this is a perfect example why I like to use the Median instead of the Average when looking at stats with major outliers. The median says the normal outperformance was for Lump Sum by 71 shares while the average was 555. This means that there were some HUGE outliers favoring Lump Sum which is falsely inflating the average and making it look better than it actually is.
Just my little stats lesson for today ?
Ok, now we’re off to look at GE!
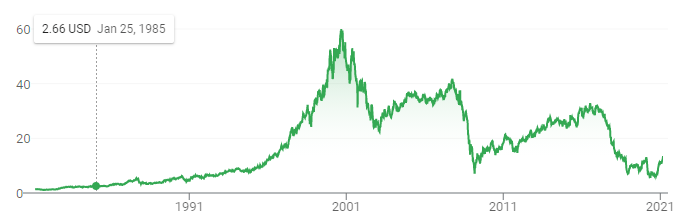
GE has had a pretty nice runup until about 2000 and then been on a volatile rollercoaster ride down since then.
There have definitely been some good years in there but overall, the share price has cut by about 80% as it peaked around $60 and now is trading at $12.54.
Again, please note that this doesn’t take in account of stock splits and is purely just a price performance perspective!
Over the course of the same 35 years that we have been evaluating, you can see the following performance:
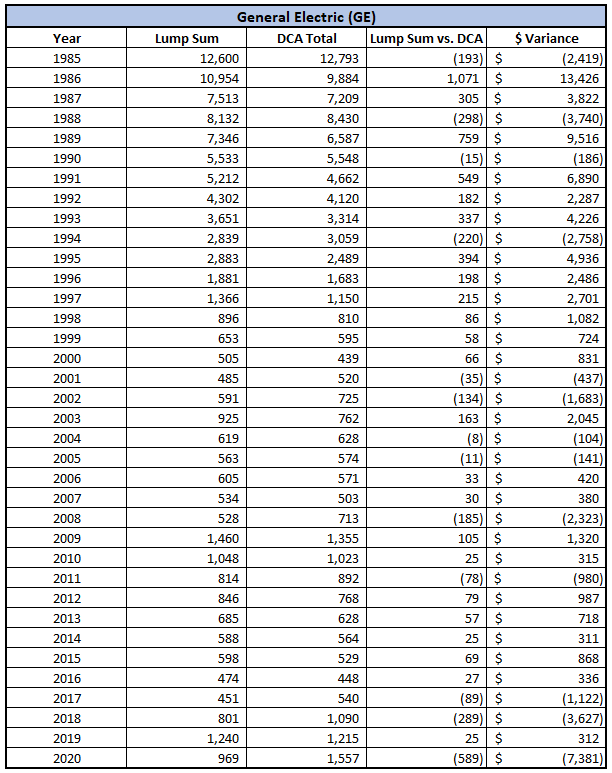
Again, hard to see the true data with the massive chart, but the variances overall seem much less volatile than some of the major moves that we saw with Apple.
Let’s take a look at all the years that DCA was better off:
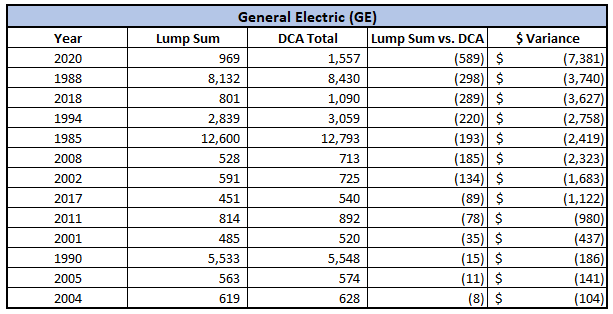
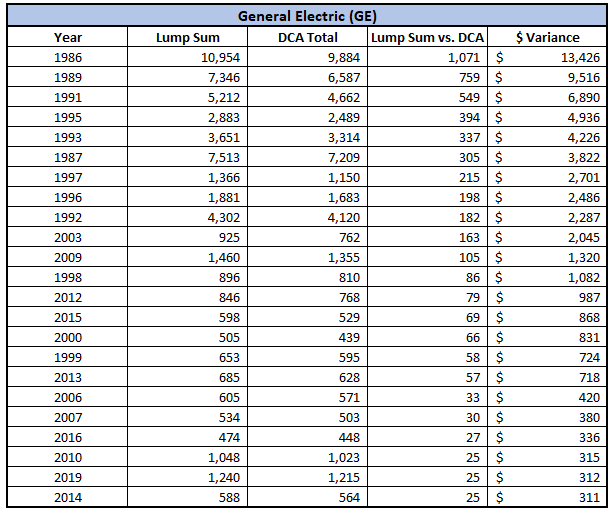
In total, 13/35 years were better off with DCA, meaning that the other 22 years showed a benefit to opting into the lump sum investing method:
Now, if we take a look at the years since 2000, we can see that DCA was preferred 9/20 times, or 45% – a larger percentage than their normal amount since 1985 or 37%.
Let’s take a look at the overall metrics between the two methods:

Again, the skew is definitely towards Lump Sum, especially when you look at the max and min performance. What this tells me is that the risk of lump sum is worth the shot vs. DCA investing over a predetermined period of time.
Summary
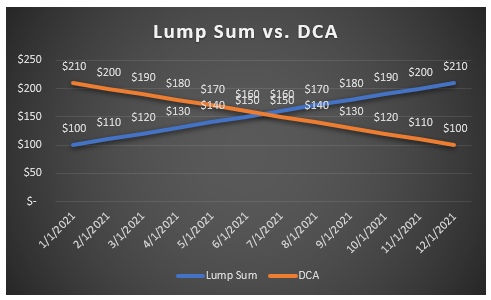
So, what does all of this information tell us? Well, it’s simple really – if you invest in a stock or ETF that is going to go up in price, you’re going to be better off lump sum investing. If that stock or ETF is going to drop in price, then you’re going to be better off with the DCA method.
Make sense? Take a look at the chart below.
This might seem obvious but I want to hammer it home – DCA investing is only better if you’re going to do it in a stock or ETF that you anticipate going down in price and then you are adding more:
My question to you is this – if you think the stock or ETF is going to go down, why would you invest in it? Personally, I would try to stay away from it if I could.
Now, one time that I do think that DCA investing is better than lump sum is if you’re trying to take advantage of a great buying opportunity. For instance, in 2020 I emptied out my rainy-day fund to take advantage of COVID-19 having a major negative effect on the stock market.
I emptied out that rainy day fund, which is very different than an emergency fund as it’s intended use is to find good opportunities and maxed out my Roth IRA by April.
Rather than just throwing in $6K all at once, I bit off chunks. I wasn’t sure when the bottom was going to hit so I slowly put in $1K over 6 different time periods, all spread out about 1 week.
I was ok doing this because I was envisioning a down market. Sure, when the market was down 10%, I could’ve held off to invest, but what if being down 10% was the low and then it rebounded, all while I was sitting on the sidelines?
One quote that I live by is to “don’t let perfect be the enemy of good” and in this case, this is exactly what I was employing. I was putting $1K in HOPING the market would go down more so I could get even better bargains the next week.
But this is a very unique, one-off type situation that doesn’t occur terribly often. During normal investing times, do yourself a favor and just dump all that money into the market!
And if your main reason for not doing that is because your stomach can’t take the risk – don’t worry. There are tangible steps that you can take to change this mindset and make you a more calm, rational, effective investor!
