Updated 7/24/2023
“If you owe your bank a hundred pounds, you have a problem. But if you owe a million, it has.”
John Maynard Keynes
In today’s low-interest environment, debt analysis must be a critical part of every investor analysis of companies. As the low-interest rate continues, more and more companies will turn to debt as a means of growth. That low-cost debt will fuel many companies to higher revenues, but it might lead to a greater risk of default or bankruptcy in some.
Learning how to assess a company’s debt load and the possible impacts of the growing debt is part of analyzing a company’s capital structure. And understanding how the company will grow, whether via debt, cash flows, or equity, will tell you much about what kind of future returns you can expect.
Many successful companies use debt to generate cash to fund acquisitions, which leads to greater growth for the company. Some of those are Amazon, Google, and Microsoft, all highly successful companies. But others, such as Lehman Brothers and Bear Stearns, took on too much debt, ultimately leading to their downfall.
In today’s post, we will learn:
- What is Debt Analysis?
- The Ratios Important to Debt Analysis
- Analyzing the Debt of a Company: Real-World Examples
Okay, let’s dive in and learn more about debt analysis.
What is Debt Analysis?
A debt analysis is a measure of the company’s ability to service the debt of a company. In simple terms, it means analyzing whether the company can afford its interest payments and ultimately repay the debt.

Debt analysis can tell investors what proportion of a company’s financing asset is from debt or other sources of financing. Debt analysis is a great way to measure a company’s solvency.
Debt load or debt capacity refers to the total amount a company undertakes and its ability to repay according to the terms of the debt agreement. Companies take on debt for a variety of reasons:
- Acquiring a new business
- Increasing efficiency with new processes
- Adding more capacity with new plants, property, or equipment
- Increased marketing
But whatever the reason, if a company takes on too much debt or the wrong kind of debt, that could result in dangerous consequences if the desired result goes wrong.
For example, consider this scenario; Company A takes on debt to buy another business for $1 billion. The interest payments are $30 million a year, but the company’s free cash flow only supports interest payments of $35 million. If Company A’s cash flow drops for any reason, the company risks defaulting on the loan.
Analysis of a company should include deeper looks at the company’s debt structure, interest payments, cash flows, and credit rating. These types of analysis help give you a deeper understanding of the company, plus what kinds of options are available for growth.
The Ratios Important to Debt Analysis
To properly analyze a company’s leverage, we need to look at various aspects of the company’s financials. We need to assess the following:
- Ability to make the interest payments
- Balance sheet strength
- Cash flow

To conduct the analysis, the best method is the use of ratios. These ratios allow investors to look across the company’s financials and assess its strength, its ability to handle its current debt load, and any future additions to that debt load.
Interest Payments
The company’s interest payments are the monies it owes its debt holders. For example, when Microsoft issues a bond offering, it is offering the debt of Microsoft to investors in return for interest payments and the return of that initial cash.
For example, Microsoft has a bond offering coming due in 2021, which they offered for a coupon payment of 2.125%, which means for the $1,000 the investors gave Microsoft, they would receive $21.25 every year.
The best way to measure the impact of interest payments on the company is to use several ratios:
- Interest Coverage Ratio
- EBITDA Coverage Ratio
Both ratios show that a company can afford to cover interest payments from its operating and free cash flow. In general, the higher the ratio, the better.
For example, the interest coverage ratio is the simplest of all; it divides the operating Income of Microsoft by its interest expense. We can find both items on the income statement. The most recent income statement, dated 6- gives us:
- Operating Income = $69,916 million
- Interest expense = $2,346 million
Then dividing the operating Income by the interest expense gives us an interest coverage ratio of:
Interest coverage ratio = $69,916 / $2,346 = 29.9 times or 29.9x
Remember that the higher, the better, and the above ratio tells us that Microsoft could afford more interest payments.
Expanding to look at the EBITDA versus the interest payment, we see that:
- Operating Earnings = $69,916 million
- Depreciation/Amortization = $11,686 million
- EBITDA = $81,602 million
- Interest Expense = $2,346
So, calculating the EBITDA to interest expense equals:
EBITDA coverage ratio = $81,602 / $2,346 = 34.78x
Again, we can see that Microsoft has plenty of room for interest coverage.
Balance Sheet Strength
Analyzing the balance strength means using popular credit metrics such as debt to equity and debt to assets, which help compare the company’s debt to its assets and equity, the main growth components.
The balance sheet helps tell us how strong the company is financially, and both assets, debt, and equity help drive the company’s growth, depending on its capital structure. Using metrics comparing equity and assets to debt helps tell us how much debt capacity the company carries and can carry.
Debt to equity, probably the most common metric, helps give us a high-level view of Microsoft’s capital structure. However, the metric, like any, is not perfect, and there can be some discrepancy between the book value and market value of equity because of acquisitions, goodwill, any adjustments to assets, and finally, any impairments to goodwill.
Despite that, it is a great way to get an overview.
To calculate the debt to equity, we look for Microsoft’s debt, which includes:
- Short term debt
- Long term debt
- Capital leases
- Shareholders’ equity
We can find all of these items on the company’s balance sheet:
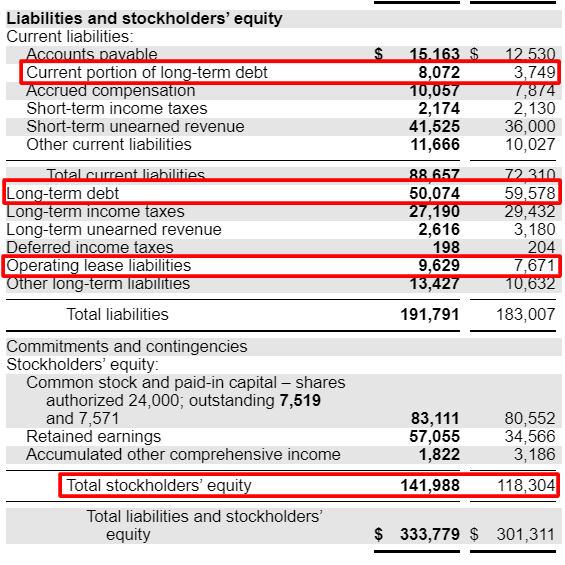
Pulling the data from the above balance sheet, we see:
$ millions | 2021 | 2020 |
Short-Term Debt (+) | 8,072 | 3,749 |
Long-Term Debt (+) | 50,074 | 59,578 |
Operating Lease (+) | 9,629 | 7,671 |
Total Debt | 67,775 | 70,998 |
Equity | 141,988 | 118,304 |
Debt to Equity | 0.47 | 0.60 |
The calculations above tell us that for every dollar of equity, Microsoft has 47 cents of leverage and 60 cents for each dollar for 2020.
A higher debt-to-equity ratio tells us how levered a company is, meaning how much debt it carries relative to its equity. Generally, the lower, the better, but as with much of finance, it depends on the company’s situation.
You could debate that a company like Microsoft could lever up more because of its strength in free cash flow. The increased debt level would help Microsoft grow faster, possibly, but it also increases the company’s risk level.
Analyzing the company is important because some companies can carry more debt than others, but it needs to be addressed company by company.
The debt to asset ratio tells us how levered the company is compared to its assets. We calculate the ratio as before by comparing it to its assets instead of equity.
For example, Microsoft’s debt-to-asset ratio, using the same debt loads from our above chart:
$ millions | 2021 | 2020 |
Total debt | 67,775 | 70,998 |
Assets | 333,779 | 301,311 |
Debt to Asset Ratio | 0.20 | 0.24 |
Of course, the low numbers indicate that Microsoft has 20 cents compared to each dollar of assets.
Most investors look for a range of 0.3 to 0.6, depending on the company and industry it operates. But generally, the lower, the better, but again it depends on the company’s financial situation and where it is in its business life cycle.
The final ratio to analyze Microsoft’s debt load is the net debt to EBITDA ratio.
The net debt to EBITDA ratio is a good ratio to compare the debt to the company’s cash flows. EBITDA represents cash flows well because it adds back depreciation and amortization, non-cash expenses.
A good net debt to EBITA ratio to look for is anything under 4x, but that is a generality.
Since we already have calculated EBITA before, we only need to determine net debt, represented by:
Net debt = Total debt – cash and equivalents
Again, we can find all the items on the balance sheet, and the total debt we calculated before remains the same, but we take the cash and equivalents from the asset section of the balance sheet:
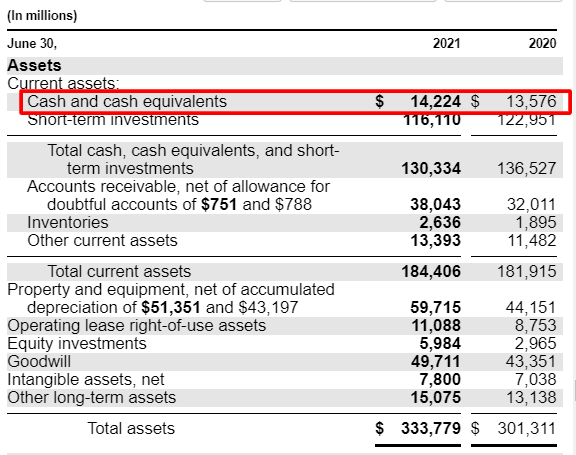
To calculate the net debt to EBITDA ratio we:
$ millions | 2021 | 2020 |
Total debt | 67,775 | 70,998 |
Cash (-) | 14,224 | 13,576 |
Net debt | 53,551 | 57,422 |
EBITDA | 81,602 | 65,755 |
Net debt to EBITDA | 0.65 | 0.70 |
The calculations tell us that Microsoft could pay off all of its net debt in less than a year, which is quite good and indicates strong financials.
A higher number gives you less wiggle room concerning the company’s free cash flow.
To dig deeper into each of the above ratios, please follow the links to understand better how these calculations work. Understanding the ratios and how they work will give you a great foundation to analyze any company’s debt capacity and structure.
Remember that each company is different, and industries or sectors carry higher debt loads. For example, utilities and REITs carry much higher debt loads than software companies like Facebook because of the nature of the business. Instead, analyze each company relative to itself and others in the same industry.
Analyzing the Debt of a Company: Real-World Examples
To analyze companies, I think the best way to set it up is to look at a few companies in the same industry and compare them across their financials using the ratios.
To do this, we will work through the above ratios and grade them based on their performance. For ease of use, I will pull the numbers together from the financials, and then we will make a chart with the comparable metrics and go from there.
The industry I thought might be interesting to look across is the core banking industry which encompasses four companies:
- Fiserv (FISV)
- Fidelity National Information (FIS)
- Jack Henry (JKHY)
- Global Payments (GPN)
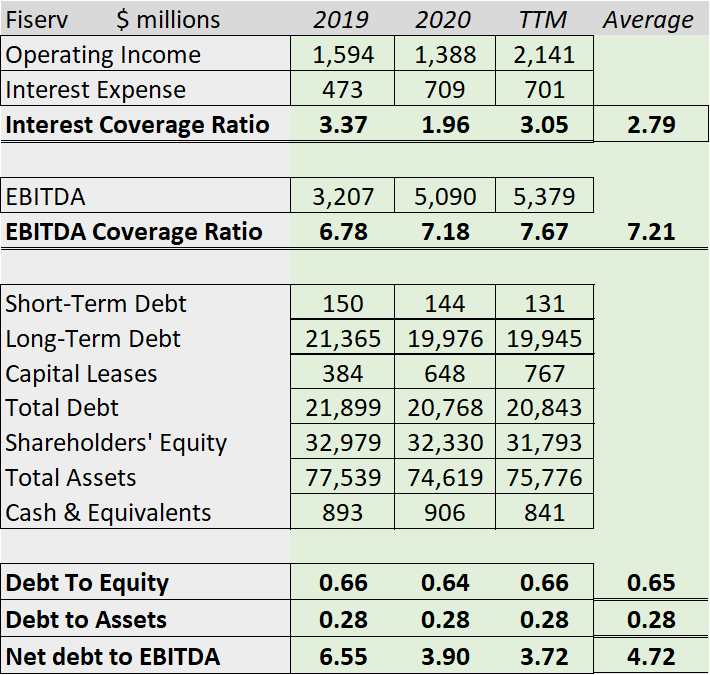
The first company I will analyze is Fiserv, and we will use the last three years of numbers, including the TTM (trailing twelve months).
Here are Fiserv’s numbers:
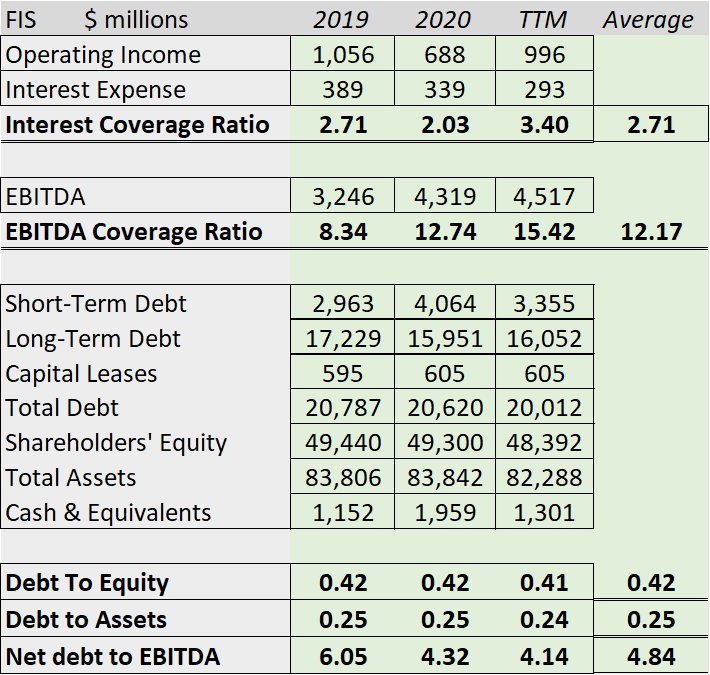
Now, we will do the same for FIS:
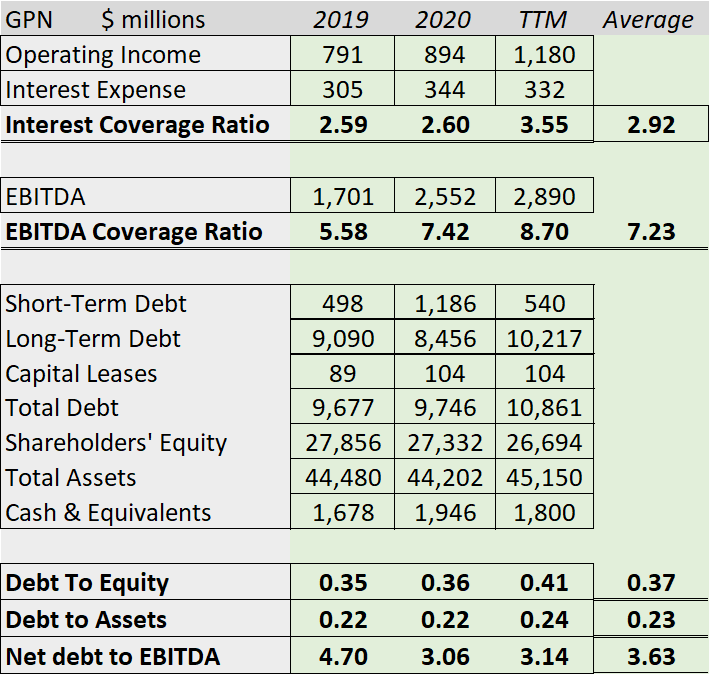
Next, we will look at Global Payments:
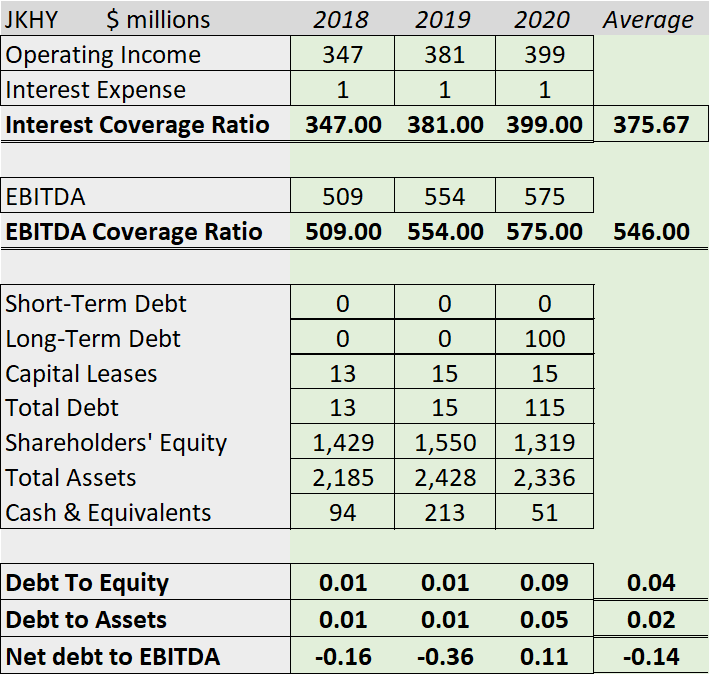
Finally, we will calculate the ratios for Jack Henry:
Okay, now that we have that all taken care of, let’s compare the ratios across their averages.
Item | FISV | FIS | GPN | JKHY |
Interest Coverage | 2.79x | 2.71x | 2.92x | 375x |
EBITDA Coverage | 7.21x | 12.17x | 7.23x | 546x |
Debt to Equity | 0.68 | 0.42 | 0.37 | 0.04 |
Debt to Assets | 0.25 | 0.25 | 0.23 | 0.02 |
Net debt to EBITDA | 4.28x | 4.84x | 3.63x | -0.14x |
What does all of this tell us?
First of all, the sector has fairly strong financials across the board, with all the companies carrying decent interest coverage ratios, with Jack Henry having the highest with little to no long-term debt.
The EBITDA coverage ratios tell us that all four companies have adequate free cash flow to cover the interest payments of their current debt loads, and in the case of FIS and Jack Henry, they have room to increase debt if they choose.
All four companies’ debt-to-equity and debt-to-assets show strong balance sheets with plenty of assets and equity to cover any growth in their debt loads. None of the companies are in danger of bankruptcy, looking at their debt loads on the balance sheet, with plenty of assets and equity to cover any dire financial situations.
The net debt to EBITDA paints a different picture for Fiserv and FIS, with both companies pushing higher than you would like. The higher levels for both companies result from recent World Pay and First Data acquisitions, respectively. Both the companies made the acquisitions with a combination of cash and stock, with the cash stemming from bond offerings, i.e., debt.
The deals will work out in the long term, but it puts a bit of a strain on cash flows until they reduce more of the debt load concerning the free cash flow.
It also means that both companies will need to restrain from any increases in their debt loads until the levels drop, meaning no more big acquisitions until the future unless the company wants to drive up its interest payments and put more debt on the balance sheet.
Neither company has any immediate plans to do that, with both stating their intention to pay down the debt in the short term.
Investor Takeaway
A debt analysis is a critical part of any analysis of an investment. We must understand what the company is doing to drive growth and the abundance of cheap debt in today’s markets. It is important to understand what kind of debt our company carries.
Using ratios such as the ones above is a great start to understanding the company’s debt structure. It is also important to consider a few other factors, such as the debt covenants, which can help give you a better idea of its risks. The ratios also give you great insight into the company’s liquidity, which is important in times of crisis.
The final consideration is the company’s credit rating, which can tell you how easily the company can raise debt, either for a new project or acquisition or in a time of need.
Moody’s offers a free service that can help you with a few clicks how strong their borrowing situation; for example, the above companies all carry:
- JKHY – No rating
- Fiserv – Baa2
- FIS – Baa2
- Global Payments – Baa3
All the above ratings tell us that the companies carry moderate credit risk and are investment-grade debt. Jack Henry carries no rating because they are debt-free and have been for a few years; therefore, there is no debt to rate.
You can use many more ratios, but these are the five that I have found to be the most effective; combined with reading through the debt covenants and using the credit ratings, we can get a great sense of the company’s debt.
It is best to look at your company over at least a five-year range; ten would be best, and then skim through the debt covenants to get a sense of the risk. Once you do all that, you will understand your company’s debt situation. When you read they are acquiring another company or starting a new project, you will better understand how that will positively and negatively impact your investment.
And with that, we will wrap up our discussion for today.
As always, thank you for taking the time to read this post, and I hope you find some value. If I can further assist, please don’t hesitate to reach out.
Until next time, take care and be safe out there,
Dave
