Updated 1/5/2024
Many businesses use debt to fuel their growth in today’s low-interest business world. Because debt costs are far lower than equity, many companies raise cash to grow by taking on larger amounts of debt.
The debt-to-asset ratio measures that debt level and assesses how impactful that might be for any company.
Debt can lead to big problems if it gets out of hand, and that is why it is important to analyze the company’s debt situation and determine the potential impact, good or bad.
Not all companies choose to use debt to grow, and many of these decisions depend on the sector the company operates and the cash flows the company generates. Many companies can self-fund their growth, but others use debt to fuel it.
In today’s post, we will learn:
- What is the Debt to debt-asset ratio
- How Do We Calculate the Debt to Asset Ratio?
- What is a Good Debt to Asset Ratio?
Okay, let’s dive in and learn more about the debt-to-asset ratio.
What is the Debt to Asset Ratio?
The debt-to-asset ratio, according to Corpthe orate Finance Institute, is:
“The Debt to Asset Ratio, also known as the debt ratio, is a leverage ratio that indicates the percentage of assets financed with debt. The higher the ratio, the greater the leverage and financial risk degree.”
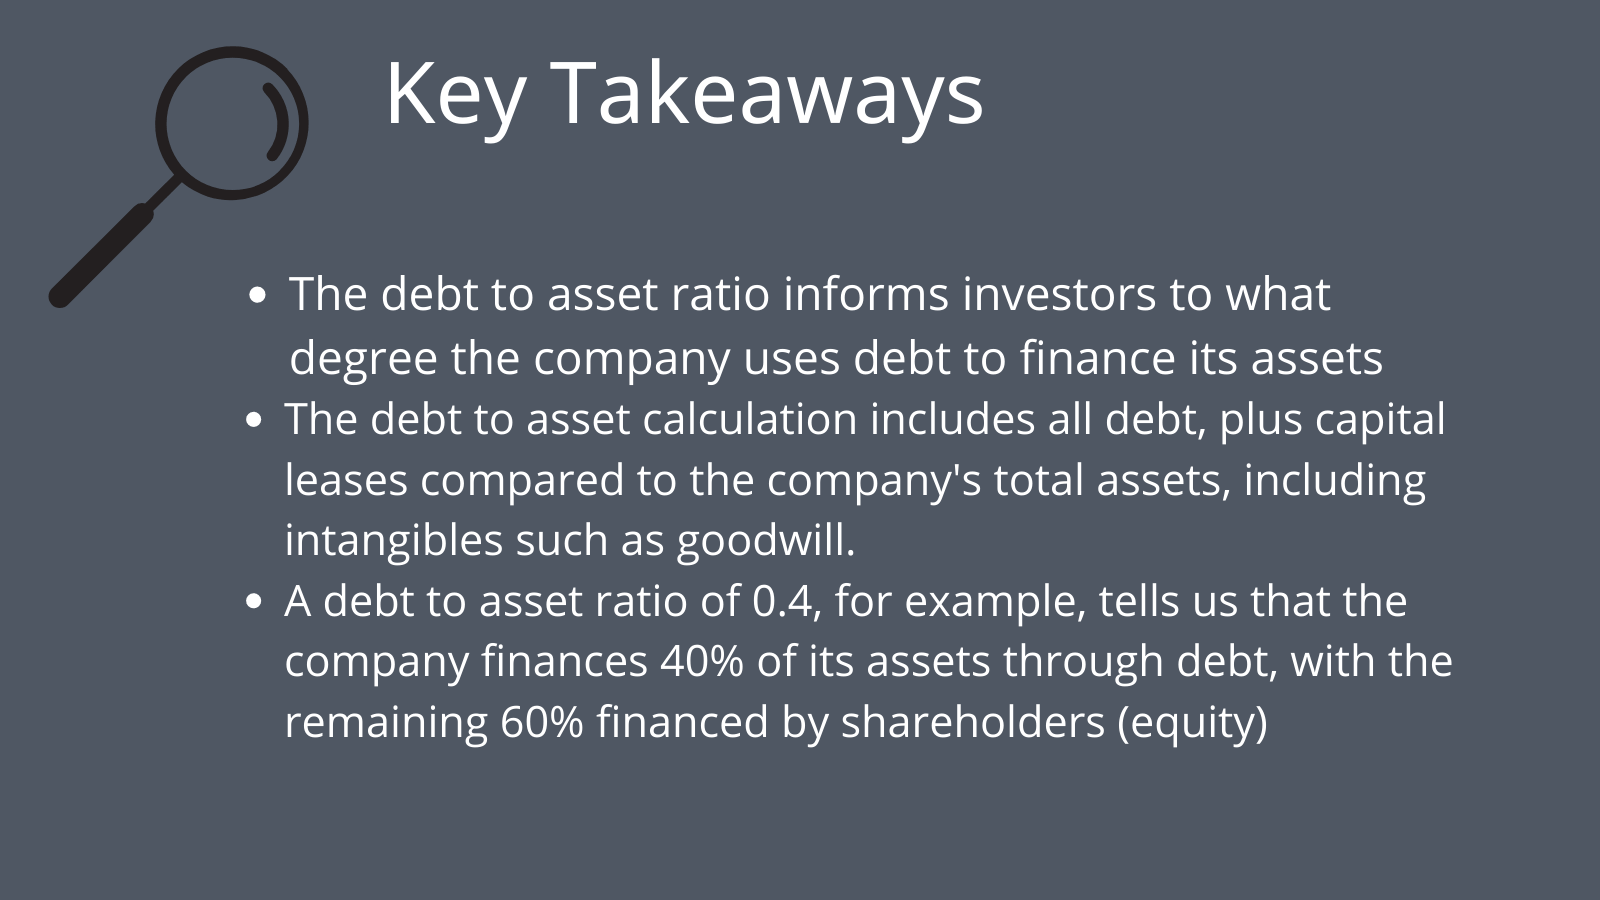
As we analyze each company, we can use the debt-to-asset ratio to analyze how much debt a company carries, its ability to repay that debt, and its likelihood of taking on additional debt.
We can also use the debt-to-asset ratio to assess the liquidity of the company, its ability to meet its obligations, and how likely they are to see a return on its investment via the debt obligation.
The debt-to-asset ratio can also tell us how our company stacks up compared to others in their industry. It is a great tool to assess how much debt the company uses to grow its assets.
A simple rule regarding the debt-to-asset ratio is that the higher the ratio, the higher the leverage. And the higher the leverage, the higher the risk of default.
We express the debt-to-asset ratio as a percentage. For example, if a company has a debt-to-asset ratio of 0.4 or 40%, then we can see that the company finances its assets with 40% of the debt and the remaining 60% by equity.
As we will see in a moment, when we calculate the debt-to-asset ratio, we use all of its debt, not just its loans and debt payable. We also consider all the assets, including intangibles, investments, and cash. You can get as granular as you want to subtract goodwill, intangibles, and cash, but you must be consistent with that process if you choose to go in that direction.
A note about debt covenants and how debt works for most companies: most companies raise capital by offering bonds or debt backed by the company’s financials. Investors loan the company money and agree to repay the loan with interest based on the pre-arranged agreement.
The debt covenant rules regarding the debt and the repayment of the debt plus interest; if the company fails to make its debt payments, it risks defaulting on its loan, leading to bankruptcy.
Repaying their debt service payments is non-negotiable and necessary under all circumstances. Other debts, such as accounts payable and long-term leases, have more flexibility and can negotiate terms in the case of trouble.
Any company’s assets are part of the growth driver, but they also help guarantee and service any debt a company carries.
The biggest takeaway is that most company debt is a loan the shareholders give the company, and the company “must” repay that loan, plus interest. The company turns around and uses that loan (debt) to reinvest in the company to grow it. We can use the debt-to-asset ratio to measure the amount or percentage of debts to assets.
Consider that a company with a high amount of leverage or debt may run into trouble during times of stress, such as the recent market downturn in March 2020. Studying the debt situation for any company needs to be part of your process.
How Do We Calculate the Debt to Asset Ratio?
The formula to calculate the debt-to-asset ratio is straightforward:
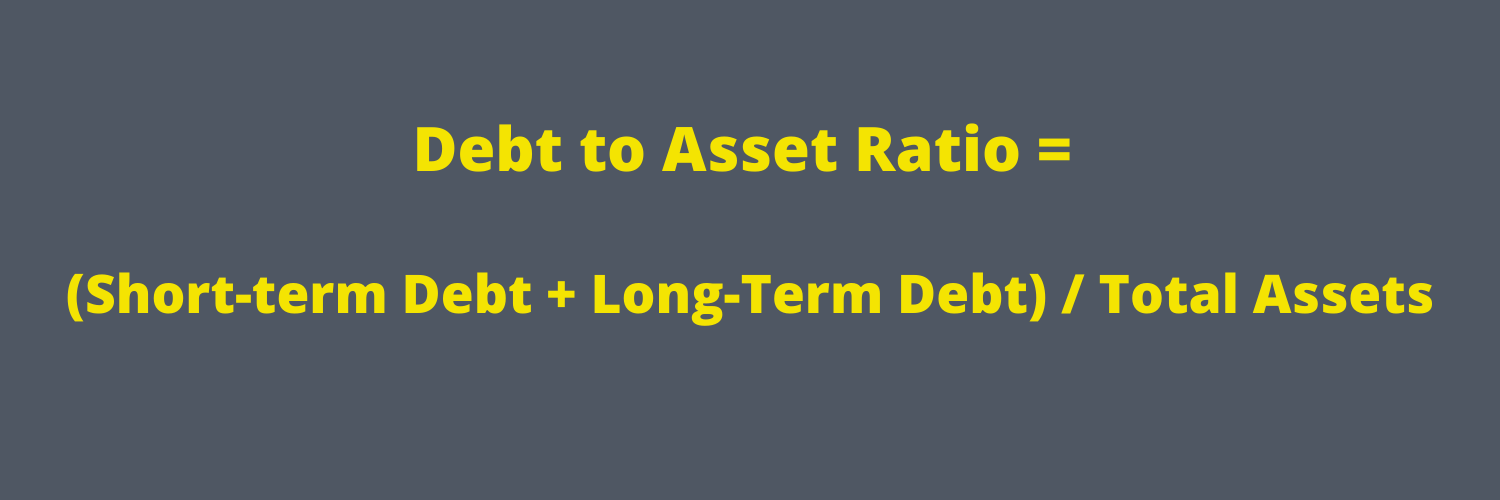
Capital leases listed on the balance sheet are in short-term and long-term debt. The total assets include goodwill, intangibles, and cash, encompassing all assets listed on the balance sheet at the analyst’s or investor’s discretion.
Examples
Let’s look at a few companies from unrelated industries to understand how the ratio works to put this into practice.
Our first guinea pig will be Microsoft (MSFT), and we will use the latest 10-k to calculate the numbers. I will screenshot the company’s balance sheet and highlight the inputs for our ratio.
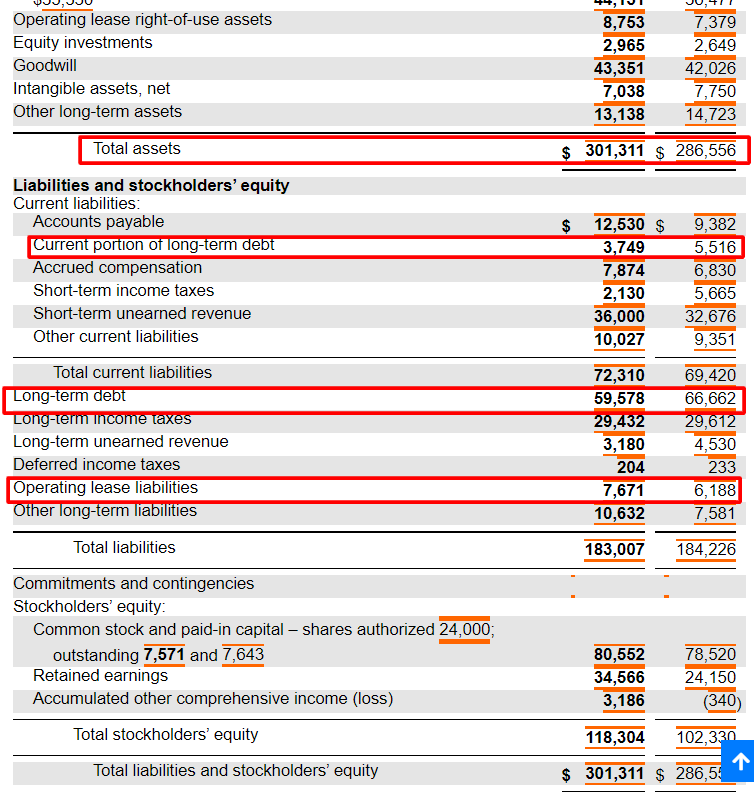
Now, pulling the numbers from Microsoft’s balance sheet, we see:
- Total assets – $301,311 million
- Current portion of long-term debt (short-term) – $3,749 million
- Long-term debt – $59,578 million
- Operating lease liabilities – $7,761 million
Putting all that together in the ratio’s formula, we get:
MSFT Debt to asset ratio = (3,749 + 59,578 + 7,761) / 301,311 = 0.2359
The above calculations show that Microsoft funds 23.59% of its assets with debt. Comparing that to others in their sector, such as:
- Adobe (ADBE) – 0.18
- Oracle (ORCL) – 0.64
- Square (SQ) – 0.37
- Crowdstrike (CRWD) – 0.27
Simple, huh? Okay, let’s try another, but let’s switch gears, look at the utility sector with NextEra Energy Partners (NEP), and use their latest 10-k, dated February 16, 2021.
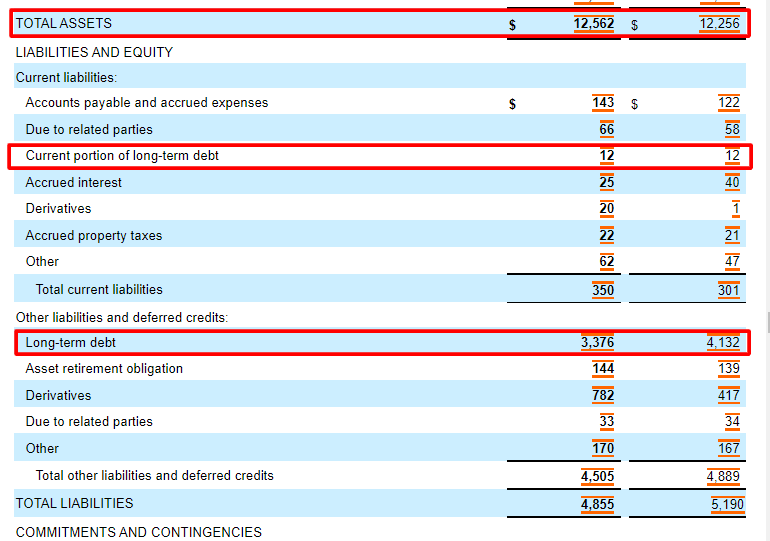
Now, taking the numbers from NextEra Energy Partners’ balance sheet, we can calculate the debt-to-asset ratio:
- Total assets – $12,562 million
- Current portion of long-term debt – $12 million
- Long-term debt – $3,376 million
NXP Debt to asset ratio = (12 + 3,376) / 12,562 = 0.2697
The ratio tells us that NextEra funds their assets with 26.97% of the debt, which compared to a few competitors:
- Brookfield Energy Partners (BEP) – 0.37
- Consolidated Edison (ED) – 0.40
- DTE Energy (DTE) – 0.44
Okay, let’s take a look at one more for giggles. For the last example, let’s look at an industrial, Albemarle (ALB), the lithium mining company, using their latest 10-k, dated February 16, 2021.
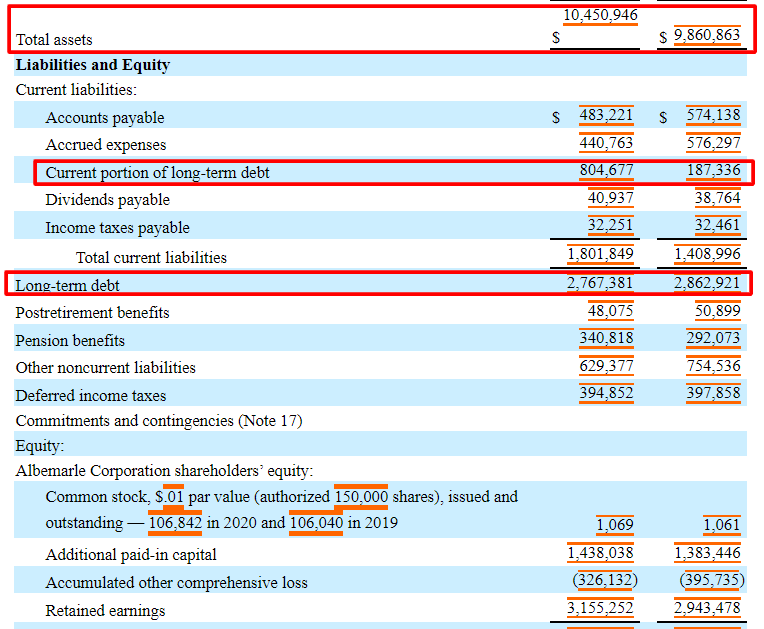
Pulling the information from Albemarle’s 10-k, we get the following:
- Total assets – $10,450,946 thousand
- Current portion of long-term debt – $804,677 thousand
- Long-term debt – $2,767,381
And now, putting those together in our debt-to-asset ratio, we get:
Debt to asset ratio = (804,677 + 2,767,381) / 10,450,946 = 0.3417
That tells us that Albemarle’s debt funds 34.17% of its company’s total assets.
After all, we get a pretty good idea of how the ratio works and what to look for when calculating the debt-to-asset ratio.
What is a Good Debt to Asset Ratio?
Generally, most investors look for a debt ratio of 0.3 to 0.6, the ratio of total liabilities to total assets, which is the reverse of the current ratio, total assets divided by total liabilities.
The debt-to-asset ratio is another good way of analyzing the debt financing of a company, and generally, the lower, the better. Because companies receive better reactions to lower debt ratios, they can borrow more money. The lower the ratio, the more room the company has to borrow. The higher the ratio, the higher the interest payments and less liquidity.
Part of company growth uses debt as financing. Across the board, companies use more debt financing than ever, mainly because the interest rates remain so low that raising debt is a cheap way to finance different projects.
Compare that to equity financing, which is far more expensive as the stock market grows and equity prices increase. As the market stays frozen, more companies will turn to debt financing to grow their revenues and company.
The lower debt-to-asset ratio also signifies a better credit rating because, as with personal credit, the less debt you carry, the more it helps your credit rating.
The higher the ratio, the more leveraged the company and riskier the investment.
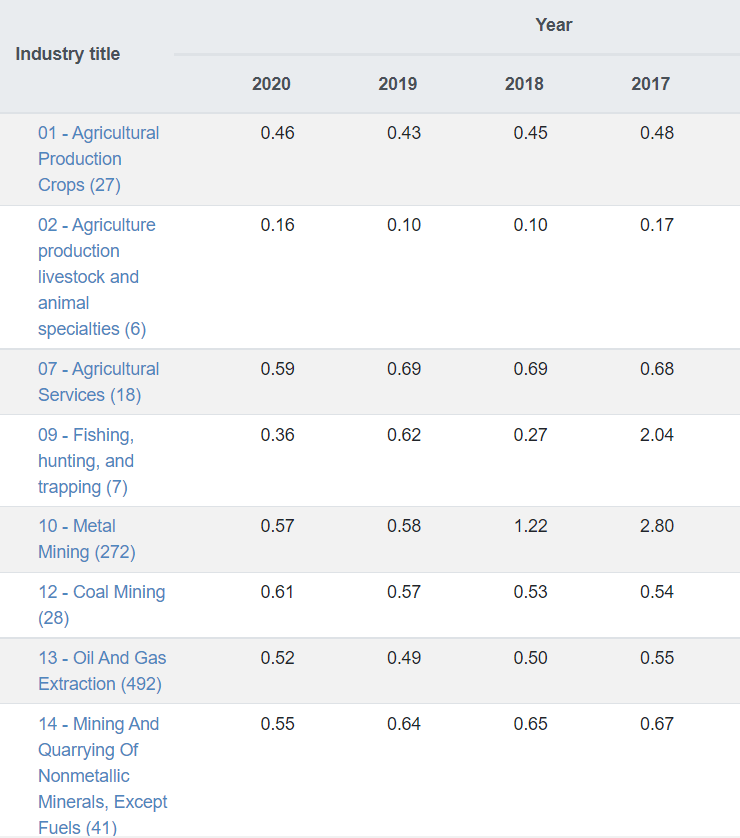
Chart courtesy of readratios.com
Readyratios.com has a chart outlining the industry medians over the last five years, which is a great resource for finding the median for the industry you are analyzing and comparing your company.
The overall market has debt-to-asset ratios averaging between 0.61 and 0.66 over the last five years.
Investor Takeaway
The debt-to-asset ratio is a very important ratio to use when analyzing the debt load of any company. A ratio higher than one indicates that most of the company’s assets funding comes from debt and that a higher debt load carries a higher risk of default.
Typically, the lower the ratio, the better, but as we saw with our analysis of the above companies, each industry carries different debt loads. It is important to compare your company to others in the same industry.
As with any ratio analysis, it is a great idea to analyze the ratio over a while; five years is great, and ten years is even better. Looking at longer periods helps analysts assess the company’s risk profile and improve or worsen.
The debt-to-asset ratio, debt-to-equity ratio, and interest coverage ratio are great tools for analyzing the debt situation of any company. Looking at the raw number on the balance sheet won’t tell you much without context. It is a great practice to analyze the debt using the above ratios and read through the debt covenants to understand each company’s debt situation.
With that, we will wrap up our discussion on the debt-to-asset ratio.
As always, thank you for taking the time to read today’s post, and I hope you find some value in your investing journey. If I can further assist, please don’t hesitate to reach out.
Until next time, take care and be safe out there,
Dave

Dave Ahern
Dave, a self-taught investor, empowers investors to start investing by demystifying the stock market.
