Disney (DIS) recently just rolled out their new online streaming platform, Disney Plus, and it has sparked a huge amount of conversations about the company and their stock price, so why not take a look at the historical DIS Dividend and see if we can take a stance about what might be happening in the future!
DIS implanted a divided for their company in 1989 and they have experienced quite a bit of volatility over that time in the average annual increase in total dividend payments vs. the prior year.
Below is a really cool set of graphs from one of my most frequently visited investing websites, Macro Trends
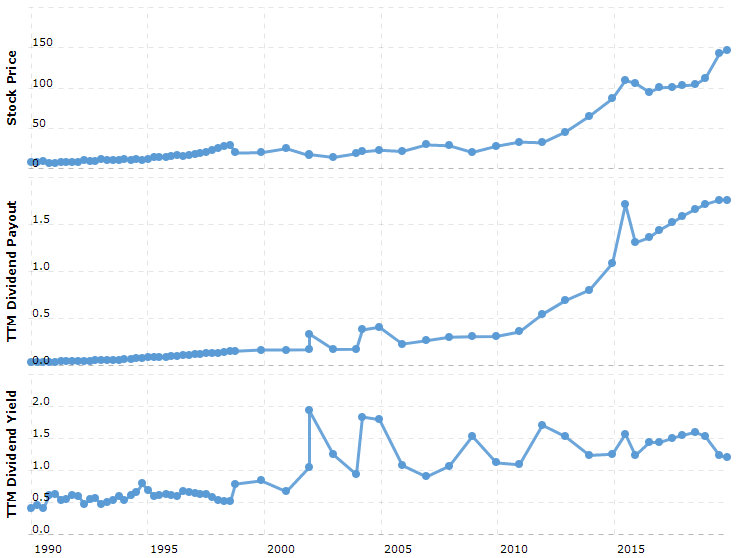
The first graph shows you what the DIS stock price has done since 1989 and as you can see, you should be very happy if you bought into the company at that point and held onto the stock throughout the years as DIS is now being priced right around $150/share.
The Total Dividend Payout in the second graph follows a pretty similar path as the share price which makes sense.
As the price of the stock is increasing, you would expect for the dividend payments to increase at a very similar rate unless there was a major disconnect between the earnings of the company and the share price at some point. So far, so good!
The last graph might be where your stomach gets a little upset. There has been quite a bit of volatility in the DIS Dividend Yield throughout the last 30 years.
I mean, essentially starting in 2000 the dividend yield has spiked to around 2% and then dropped back down to slightly under 1%, almost on a ratable basis, for every 2-3 years. The volatility is starting to drastically slow down as we get to 2015 and beyond, but is that actually a good thing?
I know that we’re really only talking about a change of 1.5% or so in change from year to year, but if you’re investing in DIS for the dividend, that really is a big change! The difference of 2% to 1% is not a 1% difference in my eyes – it’s a 50% difference because the yield is literally being cut in half!
This type of volatility can be good at times but can also be really dangerous. The good news is that DIS has not decreased their dividend since they implemented it. Take a look at the year-by-year breakdown below:
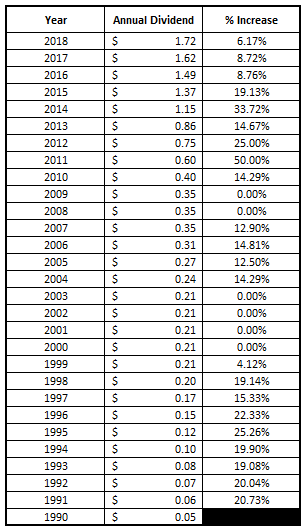
Personally, I like to use graphs as a “first glance” to understand the big picture of what might be going on for any analysis and then I like to dive into the numbers in a chart form as I have outlined above. As you can see, there really is a lot of volatility in the last column outlining the percentage that the DIS Dividend increased over the previous year.
The most that the dividend ever increased was 50% in 2011 and the least was a 0% increase for four straight year from 2000-2003. The average DIS dividend increase was 14.32% while the Median, which is commonly used as a way to identify the true average and help throw out outliers, was 14.48%, so very similar to the actual mean.
I went a little further and tried to break it up into 7 different 4-year segments to identify the average DIS Dividend increase during that time period and the results are below:
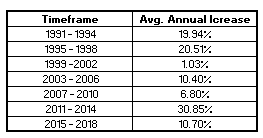
Unfortunately for us all, I really don’t see a huge trend, either from year to year or looking at these four-year periods. This isn’t really too surprising as the DIS Dividend has had a long history of being volatile and not really predictable but sometimes companies will start to realize more stable dividend growth as they grow larger and larger, which DIS appears not to have done for one reason or another.
The one trend that I am picking up is that two separate times have we seen DIS with a long period of very healthy dividend growth years, like right around 20% CAGR, from 1991 – 1998 and then again from 2011 – 2015, with a short period in between with strong growth from 2004 – 2007.
Below is a graph with some handpicked time periods that show how the Avg. Annual Increase has fluctuated so much. Like I said, these are handpicked, so the time periods are different lengths but simply being used to show the volatility.
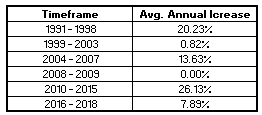
As you can see, it’s almost like the avg. annual increase is cyclical in a sense as it goes from single digits, and in some cases 0%, up to avg increases near 20% and above! I did this for me to try to understand if I think the dividend might be near the end of one of those lower periods and is about to spike up or not.
It is imperative to not use this chart for the sole reason as to why you would invest in the company for many reasons. One of which is you should never invest in a company only for the dividend, but the other is that this could be the definition of confirmation bias!
If I had wanted to invest in DIS and I manipulated these timeframes to fit a narrative that I wanted to, then I was experiencing confirmation bias as I already knew what I wanted to do and was taking the numbers and manipulating them to fit my plan. This is a huge no-no in investing and can really set you up for failure.
That being said, it is good to have this in the back of your mind because it might be the thing that makes you decide to pull the trigger if all of the other requirements on your investing checklist are met.
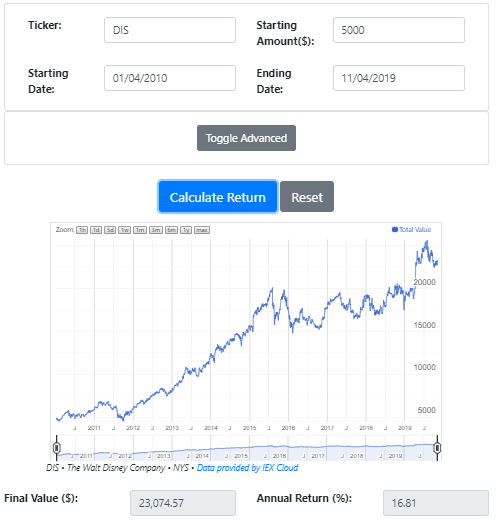
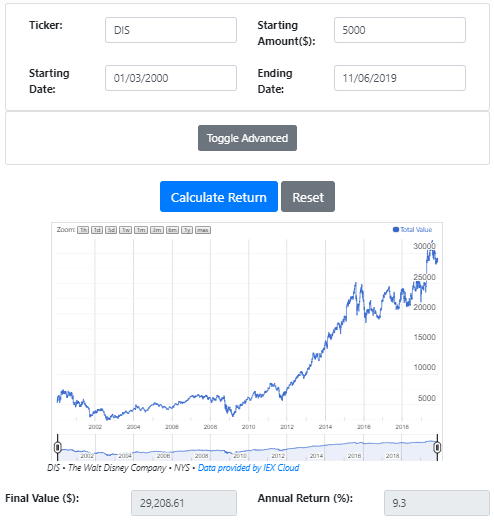
If you were waiting for me to get to this point…here we are! It wouldn’t be a post of mine if I didn’t use this cool DRIP calculator that Andrew has talked about frequently on his podcast. Below shows how your portfolio would look if you had invested $5000 in DIS stock in 1990, 2000, and 2010:
2010
2000
1990
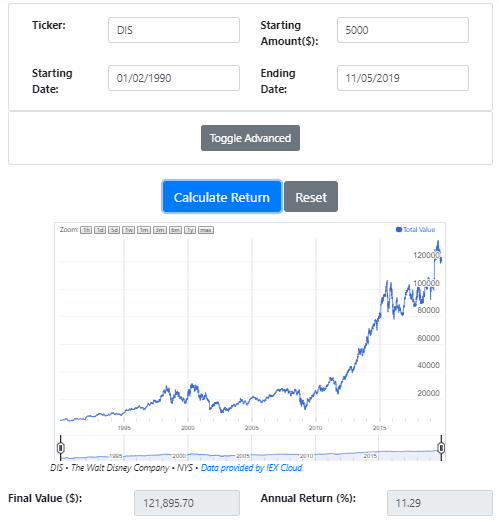
The takeaways that I have from these three time periods are the importance of finding a great, consistent, dividend and investing early! If you can do so, you will be able to reap some great rewards.
If not, you might have a long period of just average growth, so it’s imperative to do your homework first and reevaluate your portfolio at least every 6 months!
So, is the DIS dividend poised for more growth? If you ask me – I think you might be in for a treat! But, as always, do your own analysis and make sure you’re confident in your own decision, because at the end of the day, personal finance is personal and you need to be confident with you decisions because the only person it impacts is YOU!
(and your family, lol).
