Dividend Calculator. End of Post.
Kidding! But, if you’re an investing nerd like I am, then the words dividend and calculator both, independently, get me irrationally excited…so when I combine the two…I might start to salivate a little bit.
Ok – you’re probably a little freaked out right now, but if you are truly an investing nerd, I know that you’re fighting through this awful, cringeworthy introduction, so I’m proud of you. But let’s just get to the good stuff.
If you consider yourself a dividend investor, or maybe you want to be a dividend investor, then there’s two major dividend ratios that you should understand, the Dividend Yield and the Payout Ratio.
Yes, there are many other good ratios to understand as well, but from a high-level, birds-eye view, these are two good ones to start out with.
So, what exactly is the Dividend Yield and the Payout Ratio?
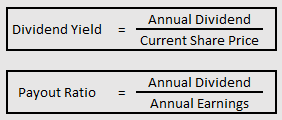
Well, they’re pretty simple really. The dividend yield is quite simply the annual amount that was paid out to shareholders via a dividend in comparison to the current share price of that company. The payout ratio is determining what percentage that the annual dividend payment is as a total of the company’s annual earnings.
In a couple previous posts, I go pretty in depth about what is a good dividend yield and a good payout ratio, so I won’t go through that again for those of you that are already knowledgeable on those subjects. But please, if you haven’t yet read those posts, please check them out by clicking on the links above.
One major thing that I have learned in my investing journey is that each piece of information is a building block for something new. If you don’t understand the basics, you’re going to be SOL when you try to apply anything.
For instance, you could just skip my advice and go straight to the bottom of this blog and download the dividend yield and payout ratio calculator, but then you’re going to be trying to understand how to apply the information that you just found.
And guess what – if you want to invest in a company, and you already know these ratios and then go try to find out what a good dividend yield and payout ratio are, you’re likely going to have confirmation bias.
When trying to learn anything new the process MUST be this:
- Understand how the process works
- Get the data that you need
- Apply it
If you try to start with gathering the data and then applying it at the same time you’re learning it…you’re going to be in trouble. And trust me – I’m not judging. I did that when I first started investing.
I was more focused on making a quick decision and then refreshing my app every 10 minutes to see how the stock was trading than I was about actually learning, and it really set me back in some of my investments.
*Steps down from soap box*
Ok, so, where were we before I went off on a tangent (again)…ah, yes…dividend yield and payout ratio. For me, personally, these are two metrics that I use a lot when looking for a dividend stock, so being able to calculate a more real-time number is very beneficial for me.
In the file attached here you can download my Payout Ratio and Dividend Calculator. When you do, you’ll see that it really is pretty simple to understand as it looks like the screenshot below:
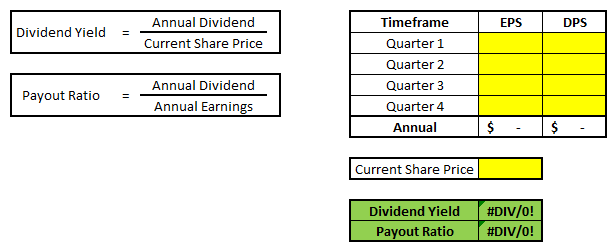
I included the formulas for your reference when you’re calculating these ratios but all that you need to do is simply input the information that is highlighted in yellow.
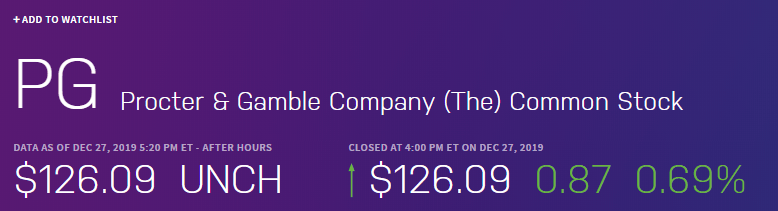
To assist, let’s walkthrough a quick example with Procter & Gamble (PG):
1 – Go to Nasdaq.com to find the information needed. For PG purposes, click here.
2 – At the very top, you will see the current price. It is important to make note of this price.
3 – You will see an Earnings Per Share chart, which I have included below, where you can hover on the bar chart to get the actual Estimated and Reported EPS amounts.

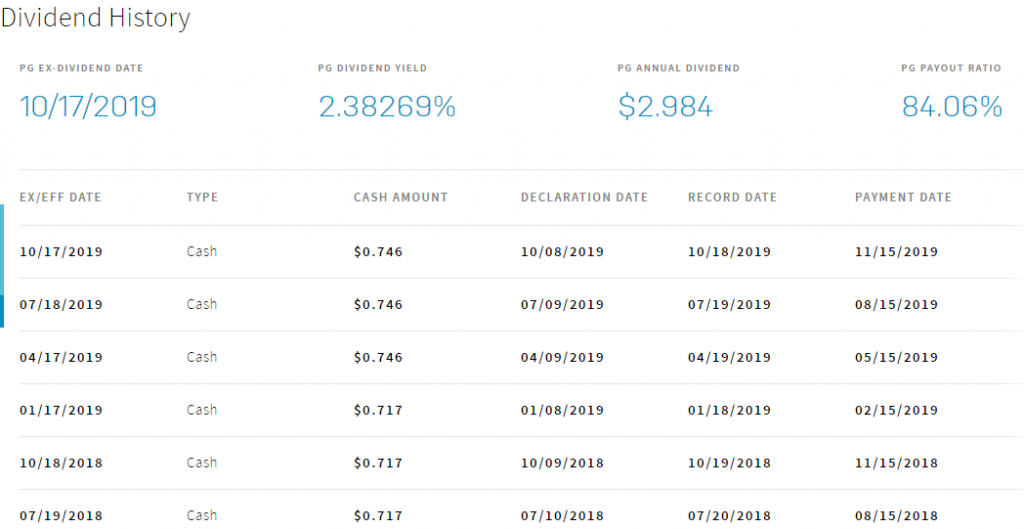
4 – If you keep scrolling down, the next thing you’ll see is the dividend payments by quarter, shown below:
5 – Your next step is to open the spreadsheet that was attached previously and begin to input these numbers.
First, you’ll input the current price of $126.09 that we included above. Then, add in the Earnings Per Share (EPS) numbers for each cell and then the Dividend Per Share (DPS) numbers as well. I have included a screenshot of my spreadsheet below:
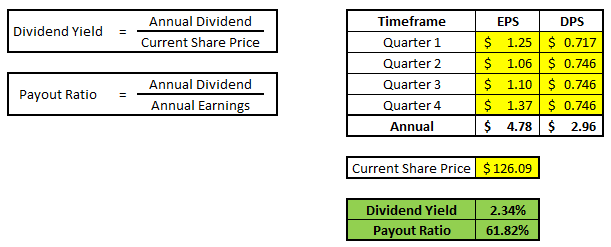
As you can see, the Dividend Yield and Payout Ratio section calculate for you automatically. You might notice that in the screenshot that had the PG DPS numbers, there also was a Dividend Yield and Payout Ratio Section.
There are two main reasons why I recommend calculating your own numbers:
- You’re getting the most up to date information, always. You’re always going to put in the most recent data, so you know that nothing is outdated.
- You’re going to get accurate information. I cross-checked my payout ratio with quite a few other sources and they all had the payout ratio as in the low to mid 60 percentile range, like what I have calculated. That is a huge difference between the payout ratio form what this website is calculating and what I have calculated (and many others, too).
Hopefully you’ll be able to use this simple calculator to help yourself get more up-to-date, accurate, information when you’re trying to make investment decisions, especially if you’re looking to build a dividend growth portfolio!
And please, if any of this seemed too in depth, go back and ready my posts about payout ratio and dividend yield so you know what to look for when doing these calculations.
I am a firm believer that you will not understand something until you can truly do the calculations on your own so dive in headfirst and get going on it! Investing isn’t just about making money – it’s about becoming more knowledgeable about your money!
