Dividend stocks are something that intrigues so many people yet so many people have no idea what to even look for when they’re evaluating those companies. Personally, I think that the payout ratio is one of the most important ratios to consider, but do you know how to properly use it? If not, don’t fear, the dividend payout calculator is here!
I feel like people love dividend stocks for one of two reasons:
- They can use the regular payments to live off of
- They will reinvest those dividends to buy more of the stock
There are obviously other reasons for loving dividends such as how they are realized gains, but I really do think that these are the main two reasons.
I actually follow a lot of accounts on Twitter that talk about how their goal is to live off of dividend payments and personally, I kinda love this goal but also am a bit fearful, because companies can cut their dividends at literally anytime without any heads up.

Now, companies know that if you have a great track record of paying a dividend, then cutting it is a major sign of bad things to come, so they will oftentimes avoid that at all costs, but it can still happen.
And honestly, the fact that companies know that cutting a dividend is a really bad sign means that when it actually happens, things are really, really bad. But this just brings light to companies like Johnson & Johnson and 3M, who are both Dividend Kings, meaning they have increased their dividend for 50+ years…which is just bonkers!
And then there’s those people (like the three amigos (Andrew, Dave, and myself…lol)), that love dividend paying companies because it’s the ultimate compound interest. Think about it in a vacuum:
If you invest $1,000 into the stock market and you earn 10%, then you have $1,100 after year 1, right? So, the next year, you would earn another 10% but now it’s on $1,100, meaning you now have $1,210.
So, you basically made an extra $10 in Year 2 because you were making money off of your gains from Year 1! So, the more time in the market, the more you can make.
But with dividends, all of the same logic applies, but you have a little extra bonus because you’re making even more money on those extra dividend payments that you’re getting!
While it’s not an insane amount, the average across the S&P 500 as of July 2020 is about 1.88%, so that’s above and beyond the market price that you see. So, $1,000 in the market means you get $10.88 in dividends. That’s not a ton, but that’s all bonus!
Important Dividend Metrics
But dividends aren’t easy. You see, a lot of people get wrapped up in the dividend yield but that is literally one of the worst things that you can do.
Because the dividend yield is simply taking the Dividend per share/share price, you’ll find people that want the highest yield but they don’t realize that a high yield might mean something really, really bad.
For instance, if a company offers a $1 dividend and their share price is $50, then the Dividend Yield is 2% ($1/$50). But if the share price drops to $20 and the dividend stays at $20, that means the yield is now 5%. Is that a good thing? To me, that’s a major red flag that bad things might be on the horizon…
But even more important than the dividend yield is the dividend payout ratio!
The payout ratio is also a very simple formula to calculate, so no sweat on that part!
All that you need to know is the Dividend/Share (DPS) and then the Earnings/Share (DPS), both are extremely easy values to find!

The reason that the dividend payout ratio is so important is because it can give you a peek behind the curtain if the dividend is sustainable or not. For instance, if the dividend payout ratio is 80% or higher, that means that the company is paying 80%+ of their earnings back to shareholders.
Sure, that’s great to get that cash back as a shareholder, but you also want that company to have some money in the bank for a rainy day as well as having the funds to continue to reinvest and grow the business, right?
I have noticed that a lot of investors will get so excited about the dividend that they almost completely forget that the company needs to continue to grow and reinvest that cash, otherwise that company has a great shot at being obsolete.
Sure, a dividend is super nice, but let’s not forget that dividends only make up about 2% of the S&P 500 11% CAGR since 1950…a much larger amount is simply growth of the company’s share price which is undeniably tied to the earnings of those companies.
A Dividend Metrics Calculator for You
To help you calculate the Payout Ratio & Dividend Yield, I have created a really cool and simple dividend payout calculator that you can download for free here!
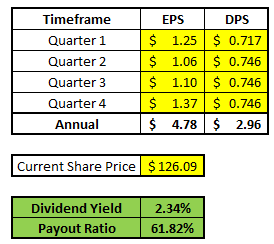
All that you need to do is to find the company’s EPS, DPS, and current share price for the last four quarters and then input them in the yellow cells that are shown below:
For instance, let’s take a look at one of my favorite stocks, Visa. Visa has a fantastic ROIC and that’s one reason that I love them, but I also like that they have a below-market dividend that continues to grow!
As I mentioned, we really need three pieces of information:
1 – EPS – When I go to Nasdaq.com, I can get all of the most recent earnings data for Visa:

2 – DPS – similar to EPS, I can also get all of the DPS information from Nasdaq.com.

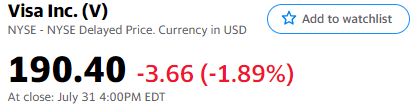
3 – Current Share Price – I will get this info from Yahoo.Finance:
Now I will just input all of this information into the chart! It’s important to note that I use the last 4 dividend amounts that have actually been paid! So, since I am writing this on 8/2/2020, that means that the most recent dividend of $.30 on 8/14/20 hasn’t been paid yet.
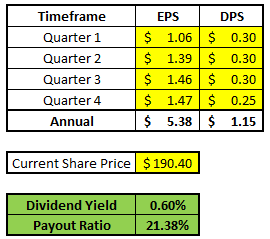
When I put this information in, you can see that the dividend yield is .6% and the payout ratio is 21.38%.
Simple as that! Now, the next question is, are you happy with that payout ratio for Visa or does it make you nervous? Don’t worry, we can help with that too!
