An Earnings Per Share analysis is one of the most common ways that investors will attempt to evaluate a stock.
My goal for this post is to make you THE Earnings Per Share expert so that you can run your own Earnings Per Share Analysis. Earnings Per Share, or EPS, is a very easy ratio to calculate, as I have illustrated below:
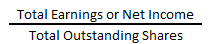
Seems pretty easy, right? It is! But it’s a pretty quick and useful ratio to help show you the exact amount of earnings that your shares are earning.
Later on, I will provide a more in-depth example by taking a look at some of the ever-popular FANG stocks but first, let’s explore some of the basics as to why EPS is such a popular ratio.
If you’ve ever watched or listened to any mainstream media about investing, chances are, the word ‘earnings’ was the most used word, regardless of what you were watching.

Earnings is all of the hype and it gets all of the coverage for right, wrong or indifferent. A lot of investors will view earnings as the end all be all when looking at a stock, but that’s likely because they are short-term investors.
Even so, if you only want to judge a stock based off the company’s earnings, the issue is that a lot of times people will confuse earnings with EPS.
Earnings vs. EPS (Earnings Per Share)
While they are in fact similar, they are most definitely not the same thing. Net Income, or Earnings, are just that.
Net Income is simply taking the revenue and subtracting all expenses from the revenue number, such as operating expenses, interest, taxes, depreciation, amortizations, preferred stock dividends, etc.
EPS is taking that Net Income, or Earnings number and then dividing it by the number of shares that are outstanding.
While that sounds like a pretty simply formula, it’s also a fairly simple formula to manipulate.
For instance, if the EPS is going up, then each share that the company has issued is earning more net income, so theoretically the company is becoming more valuable, right?
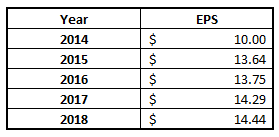
Looking at that, would you want to buy this stock? Heck yeah!
EPS continues to grow year-on-year, why wouldn’t I want to buy it?
Well, the issue is that sometimes EPS can be manipulated in a sense.
A company could actually have their earnings decreasing but their EPS could continue to grow because they have opted to buy back stock. Remember that same company that we all agreed to buy? Well, take a look at it now…
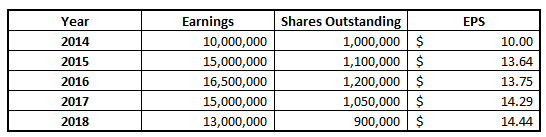
Notice how the earnings have actually slowed from 2015 to 2016, and then decreased from 2016 to 2017, and then decreased at an even faster rate from 2017 to 2018?
Is this a red flag? Probably yes, but potentially not.
It’s definitely at least a yellow caution flag.
If their earnings are beginning to decrease, you should immediately be asking the question of ‘why’ this is happening.
Is it simply a company that has very cyclical periods and it’s something that all companies in the industry are experiencing? Or is it an example where the company might seem like they’re trying to cover up slow earnings growth, or even a decrease?
Either way, the question of ‘why’ needs to be asked and you need to do some major investigating to find out if this is still a strong company with good fundamentals that you’re comfortable with going forward.
EPS Analysis on the FANG Stocks
As promised, let’s now take a look at the FANG stocks, which include Facebook, Amazon, Netflix and Google. There is a ton of hype around these stocks as they’re typically viewed as the most prestigious of a trendy group of technology stocks, so let’s take a look at their financials.
I will preface this by saying that I took their most recent reported shares outstanding numbers for my analysis, so the EPS can be slightly different than you might see online.
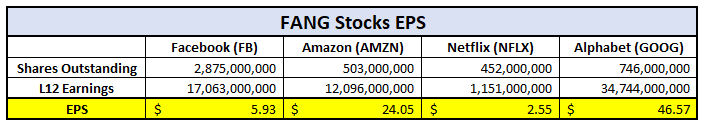
As you can see, the EPS varies greatly among the four companies. To calculate this EPA, I simply went to Macrotrends to get the Shares Outstanding and the Net Income numbers.
Macrotrends is an awesome website that I highly recommend you visit if you ever want to do some of your own in-depth analysis, or even simply to look around and see what sort of rabbit hole you can stumble into.
But at last, I digress. The first thing I did was type ‘Facebook’ in the search bar and up came the following options:
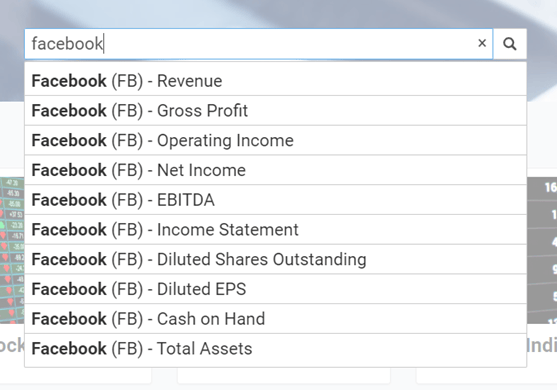
At this point, I clicked on the Diluted Shares Outstanding option and came to this screen:
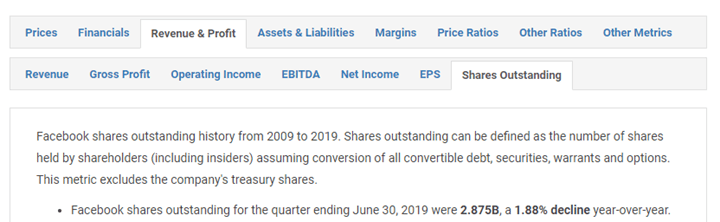
As you can see, this is where I grabbed the 2,875,000,000 amounts for outstanding shares from. My next step was to click on the tab labeled ‘Net Income’ so I could grab the Earnings portion of the formula, shown below:

From here, I simply grabbed the 17,063,000,000 number for the net income. At that point, it was a simple division problem.
Just take the total earnings, or the net income, and divide it by the number of shares to calculate that company’s EPS. See, isn’t that extremely easy…
If you’re like me then you’re always trying to find an easier, more efficient way to do things – and I think that is a great mindset.
Why Doing an EPS Analysis is Important
So, you’re likely reading this and thinking, “Andy, instead of wasting time doing this, I can just type Facebook EPS” into Google and find it, can’t I?” Yes, yes you can.
But in my opinion, investing with fundamentals is really a two-step approach, and really there’s a lot of things like this.
- You need to understand the ratio/method/fundamentals of the term you’re trying to calculate
- You need to know how to apply the result of what you found from Step 1
If you would skip step 1, you might know that a growing EPS is good, but you’re much less likely to fully comprehend all of the things that go into it and the reasonings as to why it might not be the most reliable valuation ratio for you to use.
If you only know how to do step 1, then my favorite question ever of “Who cares?” now comes into play. You know the EPS – whoopty doo. What’s next?
You need to know how to apply that into your analysis!
I challenge you that when you’re learning new valuation ratios to do this for each one.
Try to learn about the ratio and compute it yourself.
You can always fact check yourself pretty easily by googling the end result of what you’re looking for but if you only do that, you won’t actually be learning.
Chances are you are here to learn. Do you know how I know that? You’re reading a blog about calculating EPS on the Investing for Beginners Website and your google search wasn’t “what is the best stock to buy right now.”
So, don’t take the easy route – learn your way to success! And as always, do not hesitate to reach out to us – we’re all here to help!
