Updated 4/4/2024
There are many ways to value a company, including discounted cash flows, dividend discount models, value ratios, price multiples, and more. In today’s post, we will discuss the enterprise multiple, which includes a company’s enterprise value and a different measure of its revenue.
Using the enterprise multiple is a reasonably easy way to value the company, and it includes items such as debt that are not often found in valuation methods.
The multiple has several different components, including the company’s current price. One of the unique aspects of the multiple is that it looks at a company like a possible acquirer would, focusing on its debt. When you purchase a company, you buy the whole thing: assets, stockholders’ equity, and liabilities, including debt.
Today, we will learn:
- What is an Enterprise Multiple?
- How to Calculate EBITDA
- How to Find Enterprise Value
- How to Calculate Enterprise Value or EV/EBITDA
- EV/EBITDA by Industry
What is an Enterprise Multiple?
To quote Investopedia:
“Enterprise multiple, also known as the EV multiple, is a ratio used to determine the value of a company. The enterprise multiple looks at a firm like a potential acquirer would by considering the company’s debt.”

As I mentioned previously, the enterprise multiple considers items such as debt, cash, stock price, and profitability, unlike the price multiples, which relate to earnings, capital, and book value.
As value investors, we focus on price-to-earnings, price-to-book, and many other metrics, with a focus on low ratios, high payout ratios, and healthy yields.
However, each of these ratios has issues, but the enterprise multiple is the most all-encompassing and considered one of the most useful in valuing a company.
Enterprise multiples will vary by industry, depending on each sector’s growth rates. We can expect higher multiples in high-growth companies and lower multiples in lower-growth companies.
The formula for the enterprise multiple is easy to calculate and is:
Enterprise Multiple = EV / EBITDA
Ok, so what do all these terms mean?
I will break them down for you, and they are as follows.
EV or enterprise value consists of:
- Market cap +
- Value of Debt +
- Minority Interest +
- Preferred Shares +
- Minus cash and cash equivalents –
EBITDA is an acronym for earnings before interest, taxes, depreciation, and amortization.
We value that investors mainly use the enterprise multiple to assess whether a company is undervalued or overvalued. Logically, a low multiple indicates a company is undervalued, and a high one indicates overvalued.
A note about valuing international companies: evaluating companies outside of the US is useful because it ignores the different tax policies of different countries.
The multiple is also useful for finding companies that might be ripe for a takeover because it includes debt.
Now that we understand the formula and have a basic idea of the components let’s dig in and learn how to accumulate the info for each element.
How to Calculate EBITDA
EBITDA is a term used to determine a company’s profitability. As we discussed above, we take the company’s net sales and add back multiple items.

The first company I would like to analyze is Johnson & Johnson (JNJ). A fantastic dividend aristocrat with a market cap of $354B, we will use the data from the latest 10-K from December 29, 2019.
To find our numbers, we will use a combination of the income statement and the cash flow statement. Not every company lists depreciation and amortization on its income statement, so we will need to gather it from the cash flow statement.
All numbers, unless otherwise stated, will be in millions.
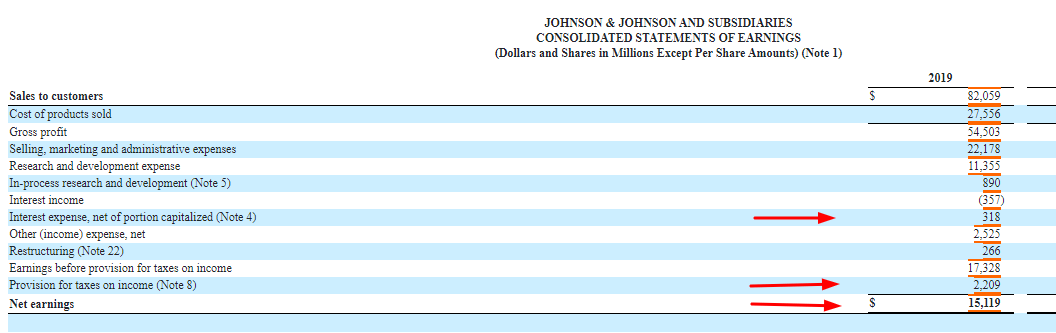
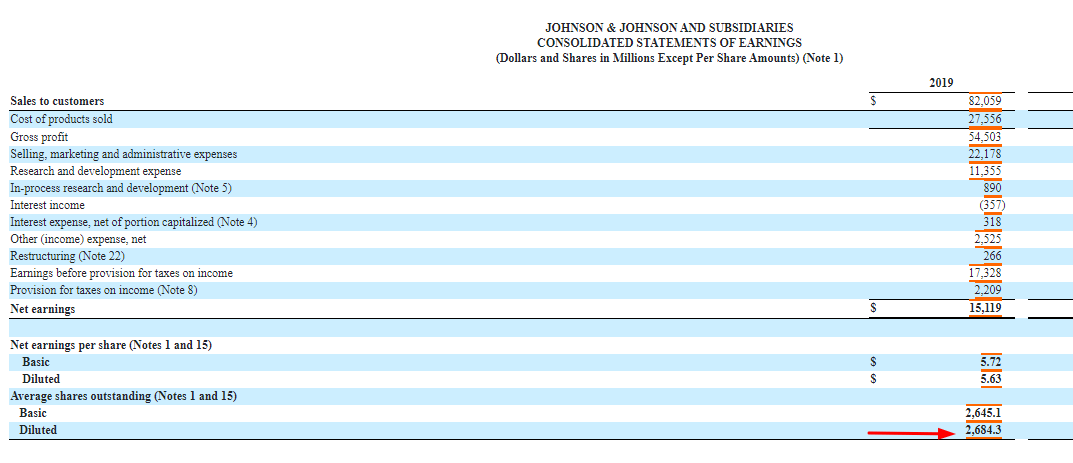
We can see from the latest income statement that Johnson & Johnson had:
- Net earnings = $15,119
- Provisions for Taxes = $2209
- Provision for Interest expense = $318
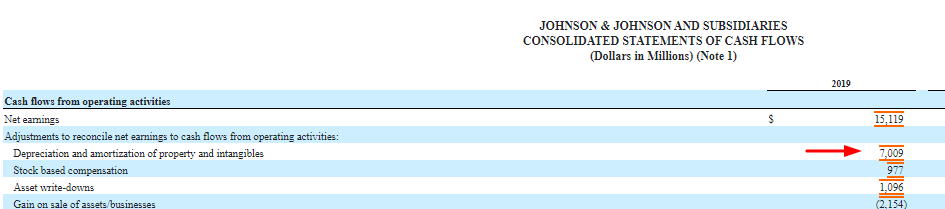
And we can see that depreciation and amortization equal $7,009.
Now, we can calculate the EBITDA for Johnson & Johnson.
EBITDA = Net earnings + interest expense + taxes + depreciation and amortization
EBITDA = 15119 + 318 + 2209 + 7009
EBITDA = 24,655
That was pretty easy; let’s examine one more to ensure we understand how this works.
The next company I would like to look at is Colgate-Palmolive (CL), another fantastic company with a market cap of $59.08B. Using their latest 10-K, dated December 31, 2019, all numbers will be listed in millions unless otherwise stated.
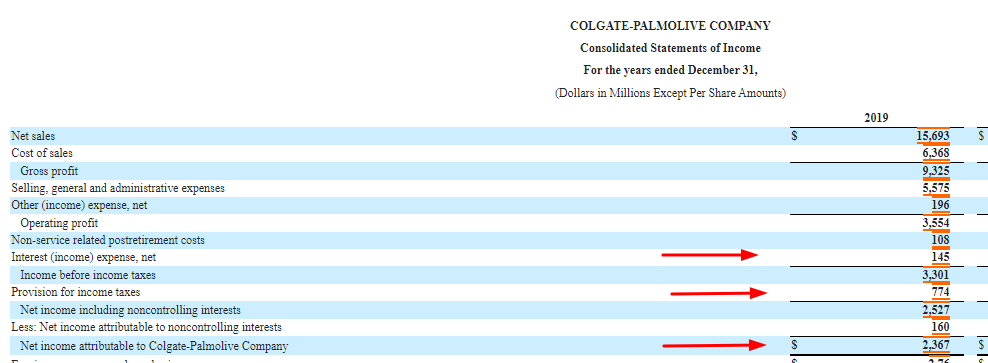
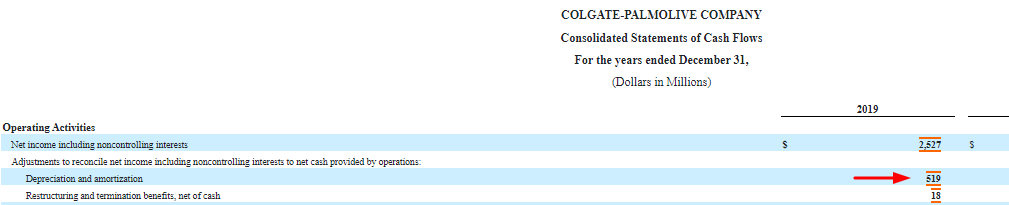
Pulling the numbers from our income statement and cash flow statement from above, we get the following:
- Net income = $2,367
- Interest expense = $145
- Taxes = $774
- Depreciation and amortization = $519
EBITDA for Colgate = 2367 + 145 + 774 + 519
EBITDA for Colgate = 3805
Ok, I think we have this down; let’s move on to the enterprise value.
How To Find Enterprise Value
Enterprise value is also a reasonably easy formula to calculate; it includes the price, shares outstanding, debt, and preferred stock. It tells you what a company is worth if sold.

The formula for enterprise value is:
EV = Market Cap + Debt – Cash and cash equivalents
Market cap is found by multiplying the current market price by the shares outstanding.
MV = Current market price * shares outstanding
The current market price is on any stock market website or app; I like Seeking Alpha.
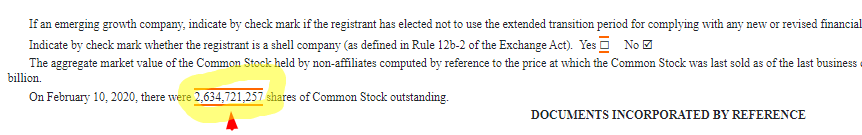
The outstanding shares can be found on the income statement or at the top of the page in the 10-K.
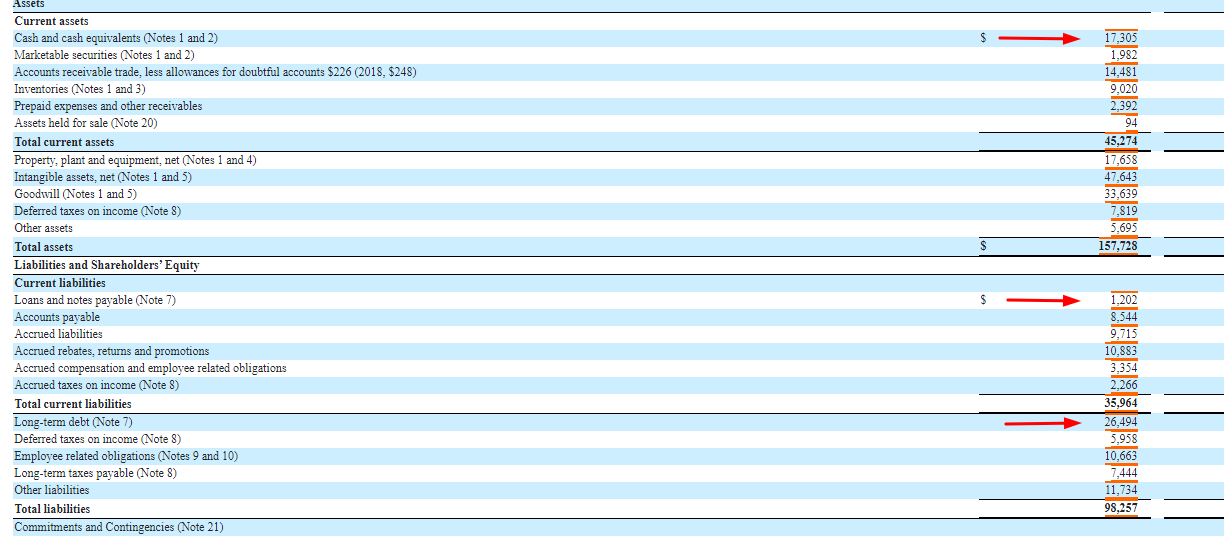
The debt is a combination of short and long-term debt that we find on the balance sheet, and finally, the cash and cash equivalents are also located on the balance sheet.
Let’s look at Johnson & Johnson as our first example to find the enterprise value.
As you can see, our numbers line up pretty quickly. I will get the current market price of Johnson & Johnson from Seeking Alpha:

Okay, now that we have all our numbers, let’s calculate Johnson & Johnson’s enterprise value.
- Shares outstanding = 2684.3
- Current market price = $134.20
- Market cap = $360.2B
- Short-term debt = $1202B
- Long-term debt = $26,494B
- Cash and cash equivalents = $17,305B
Now, plug all the above numbers into our enterprise value formula.
EV = Market cap + short-term debt + long-term debt – cash and cash equivalents
EV = 360.2 + 1.202 + 26.494 – 17.305
EV = $370.59 Billion
A note about debt, in particular, short-term debt: where the debit is notated on the balance sheet, not all companies will list the item as short-term debt; most will list the short-term under current liabilities as loans and notes payable.
Another thing to mention is when you look at Johnson & Johnson’s 10-K, they make a notation beside items that have further details in the notes. Not many do this, and it is fantastic! It makes it much easier to track down additional information and shows they are shareholder-friendly.
Example: Colgate
Let’s continue our examples with Colgate, as before.

Let’s take the numbers from above and find the enterprise value for Colgate-Palmolive.
Enterprise Value inputs:
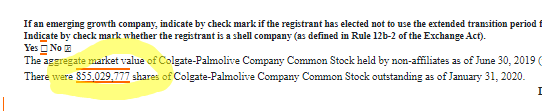
- Shares Outstanding = 855.029
- Colgate current market price = $69.10
- Colgate Market Cap = $59.08 Billion
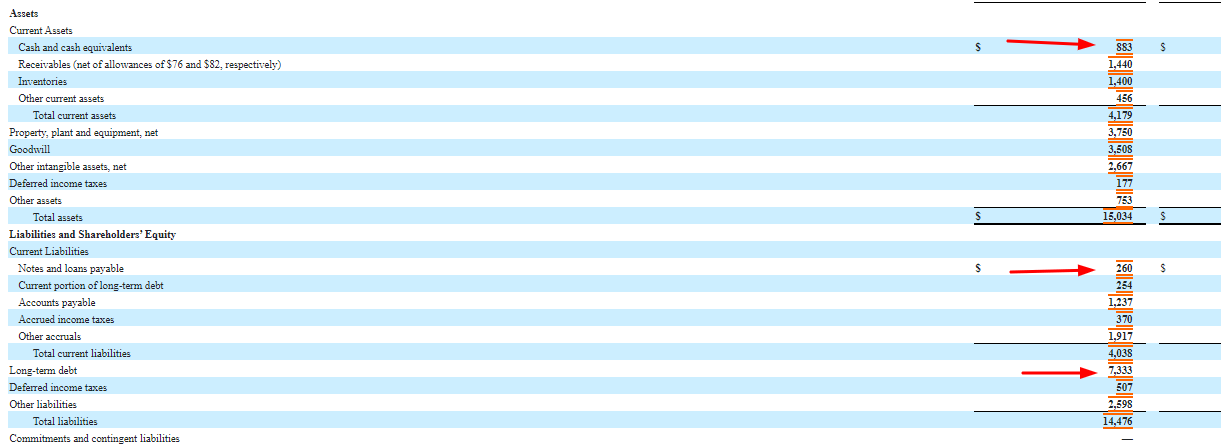
- Short-term debt = $260 million
- Long-term debt = $7.333 Billion
- Cash and Cash equivalents = $883 million
Enterprise Value = $59.08 Billion + $260 million + $7.333 billion – $883 million
Enterprise Value = $65.84 Billion
Okay, now that we have calculated both EBITDA and enterprise value, we can calculate the enterprise multiple to determine our companies’ value.
How to Calculate Enterprise Value or EV/EBITDA
Let’s use the numbers from the calculations above to calculate the enterprise value of Johnson & Johnson and Colgate-Palmolive.

First, to re-introduce the formula:
Enterprise multiple = Enterprise Value / Earnings before interest, taxes, and depreciation amortization or EBITDA
The numbers for Johnson & Johnson:
- Enterprise Value = $370.59 Billion
- EBITDA = $24,655 Billion
Now, to calculate the enterprise multiple for Johnson & Johnson
EV = 370.59 / 24.655
EV = 15.03
That was easy; now, let’s take a look at Colgate-Palmolive.
The numbers for Colgate-Palmolive:
- Enterprise Value = $65.84 Billion
- EBITDA = $3.805 Billion
Now, we will calculate the enterprise multiple for Colgate-Palmolive.
EV = 65.84 / 3.805
EV = 17.3
Those were pretty darn easy, and they helped us determine the total value of a company.
I want to show you some others just for giggles to see how this all relates.
First, let’s look at the enterprise multiple for the FANG stocks:
- Facebook (FB) = 14.85
- Apple (AAPL) = 15.69
- Netflix (NFLX) = 58.69
- Google (GOOG) = 15.22
At first blush, Netflix appears overvalued based on the enterprise multiple. However, the rest of the FANG stocks seem to be valued similarly, which is interesting.
Let’s take a look at a few more.
- Tesla (TSLA) = 50.52
- Amazon (AMZN) = 25.17
- Walmart (WMT) = 12.47
- Berkshire Hathaway (BRK.B) = 3.98
- Microsoft (MSFT) = 18.95
- Visa (V) = 24.16
- AT&T (T) = 8.45
- Mastercard (M) = 26.8
- Proctor & Gamble (PG) = 16.31
- Cisco (CSCO) = 9.23
That is a diverse list of some of the top companies by market cap in the S&P 500, and it shows some possible values mixed in the list. Berkshire was a bit of a surprise, and Cisco was too.
One drawback to using this ratio is that it is not doable with financials, particularly banks. This is because interest rate income is a significant source of income for banks and insurance companies and a substantial source of expenses. Another aspect of the difference is that the balance sheet drives everything in financials, and equity has far more importance in those sectors.
EV/EBITDA by Industry
Now that we have calculated the enterprise multiple of a few companies, the big question remains: How do they stack up? Are they overvalued?
I will cherry-pick a few industries to understand ratios and how each industry compares.
- Communications 11.38
- Consumer Discretionary 15.73
- Consumer Stables 16.62
- Energy 7.66
- Health Care 19.3
- Industrials 14.1
- Information Technology 14.52
- Materials 10.69
- Utilities 16.58
I gathered the above information from Professor Aswath Damodaran’s website. Feel free to download his spreadsheet and use it to your heart’s content.
Professor Damodaran also noted that the market enterprise multiple is 17.54 for the whole market.
Most analysts consider a multiple of 7.5 and under undervalued, while anything over 15 is considered possibly overvalued. If you use those numbers, the total market appears to be overvalued, with some sectors valued more than others.
As with any other valuation metric we use, the best use of the multiple is comparing it to others within its sector.
For example, comparing AT&T with Johnson & Johnson would make no sense, but comparing AT&T to Verizon would make complete sense.
For example, currently, AT&T has an enterprise multiple of 8.45, whereas Verizon has an enterprise multiple of 7.40. So, at first glance, it would appear that Verizon is more undervalued than AT&T.
As with any multiple or ratio, we must use the data with other metrics; otherwise, basing your investing decisions on just one parameter can have disastrous results.
Using this multiple is a great way to find undervalued companies. Several options exist to screen for companies using the enterprise multiple.
The first one I would recommend is DiscoverCL; they have a fantastic screener that allows you to screen for ideas using this multiple. There is a paywall beyond the first 40 companies they show you, so that is something to consider.
The other option that I like a lot is gurufocus.com. Their screener allows you to view all the stocks in the universe, plus you can adjust the screens for sales, market cap, valuations, dividends, and much more. I use this screener about as much as finviz.com as a great way to find undervalued companies.
One drawback of the multiple is that it doesn’t account for capital spending or inflows. If the company is growing, it could increase its working capital, which in turn inflates the cash flow.
On the other hand, if the company has spent a lot of capital growing its assets, this will reduce cash flow. However, it could increase the company’s value because more cash-generating assets were added to the company.
Final Thoughts
As we can see, no metric is perfect. All metrics must be used in conjunction with other metrics to get a better overall picture of the company’s value and health.
The enterprise multiple is a quick and easy way to determine the potential value of a company. One of the reasons I like it is the use of all aspects of the financial statements. You pull numbers from all the reports, which gives you an overall picture of the company.
Plus, the evaluation includes debt and cash on hand, as if you were going to buy the company.
Many websites make this multiple available quite quickly, but I prefer to do the calculations myself as it forces me to look at the business’s financials. It also gives you a reference when comparing one company to another. The calculations themselves are quite simple; it is merely a matter of determining where the inputs are, and once you know that, it is simple to execute.
Valuation is part art and part science. At the heart of valuing a company is finding out its worth. The enterprise multiple does a fantastic job of helping us answer that question.
As always, thank you for reading this post. I hope you found something valuable to use on your investing journey.
If I can further assist, please don’t hesitate to reach out. I am here to help in any way I can.
Until next time,
Take care,
Dave

Dave Ahern
Dave, a self-taught investor, empowers investors to start investing by demystifying the stock market.
