Earnings Per Share – the #1 most talked about metric for a company’s quarterly results (based on my experience that is backed up by 0% statistics and 100% listening to my peers when discussing earnings). There’s so much emphasis put into a companies EPS and therefore, such a huge importance on EPS estimates.
If you’ve ever listened to Mad Money with Jim Cramer or Fast Money, or really anything about investing at all, you know that EPS is really all the hype.

But why is that? Does a company’s quarterly earnings really change the value of the business? In short – no. Now, there could be something that comes up in the conference call that could fundamentally change the value of the business that also impacts earnings.
For instance, maybe a company says that while they expected to be able to continually decrease their Cost of Goods Sold (COGS), they have hit a limit to the amount that they can decrease their expenses and it basically is what it is, so now the earnings are lesser than anticipated because the COGS are higher than expected.
But, are the earnings really what is causing the concern, or is it the lack of potential to decrease the COGS?
Well, it’s not the Earnings – that’s simply the result of the increased COGS.
Ah, I digress again. But I really want to hammer home the lack of importance of earnings when you’re investing for the long-term. Investing in the short term – well, trading really – does place a major importance on EPS, and understandably so.
You’re looking for a short-term impact to the business and trying to find a way to get in and out, in a short amount of time, and capture a significant increase over what you paid in that short time.
While I personally don’t recommend letting yourself get caught up in the EPS game, I recognize that it’s very hard to do. Hell, I even love to pay attention to companies during earnings season to see how they’re going to perform. It’s almost a bit of a surprise each quarter to see how things have been going.
Now, will I let a down earnings quarter impact my decision to buy or sell? Absolutely not. But will multiple quarters of earnings growth or decreases affect my decision? Of course!
Investing isn’t about one short quarter or even a year – it’s about looking far into the future and trying to find undervalued companies now that will be hidden gems for years to come.
But I’m here today to talk about EPS and EPS estimates, and their reliability (or lack thereof).
As I mentioned, EPS is all the hype for quarterly results for a company, so there’s consistently analysts that are putting out EPS estimates for the company each quarter, but are those results actually a reliable use for your investment strategy?
To evaluate this, I looked at the four most recent quarters for 10 companies and gauged what Seeking Alpha projected their EPS to be as well as what their actual EPS was and then took a variance.
The 10 companies were somewhat random but all companies that everyone should know, and include Visa (V), Apple (AAPL), Alibaba (BABA), Amazon (AMZN), Tesla (TSLA), Exxon Mobil (XOM), Procter & Gamble (PG), General Electric (GE), Kellogg (K), and Dollar General (DG). Take a look below:
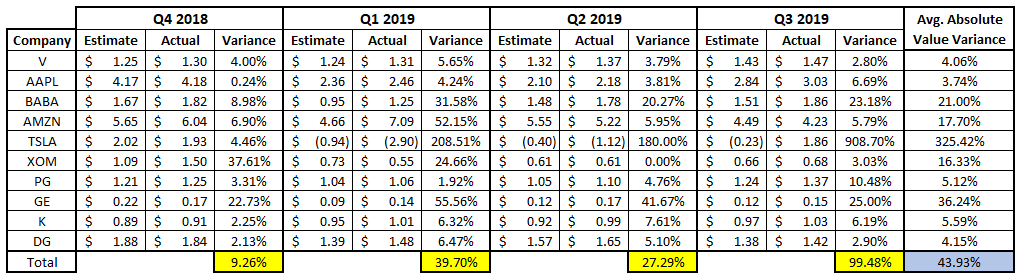
I know, it’s a lot of data right there, but let’s start off with looking at Visa. In Q4 of 2018, Seeking Alpha projected that Visa was going to report $1.25 in EPS, but their actual reported EPS amount was $1.30, which is a variance of $.05 or 4%. I did this for each quarter and then took an average absolute value variance at the end, which was 4.06% for Visa.
If you forget what Absolute Value is back from high school, it is simply the positive of any number. For instance, the absolute value of -10% is 10%. The reason that we do this is because if I wanted to find the average variance of -10% and 12%, the simple average is 1% (-10% + 12% = 2%. 2% / 2 = 1%).
But that’s not really an accurate representation of the EPS estimate, is it? In all actuality, the EPS estimate was off by an average of 11% if they were off by -10% and 12%. So, taking the absolute value variance helps us remove this negative variance that would skew the numbers.
This comes into effect anytime that we have earnings that are lower than the EPS projection (cough, cough, Tesla).
As you can see in the chart, 15/40 actual EPS reports are within 5% of estimates and 26/40 are within 10%. 13/40 estimates are more than 20% off and they primarily are regarding GE (4/4 off by 20%+), TSLA (3/4), BABA (3/4) and XOM (2/4).
Most of these large variances likely come from the unpredictability of the business, specifically with TSLA, and the impact of tariffs that were going on at the time of these earnings calls that would drastically impact GE and BABA.
Overall, the average absolute value variance is 43.93%, but that was primarily driven by TSLA who had an absolute variance of 325.42%…. lol. Without TSLA, the average amongst the nine other companies was 12.66%.
So, do you feel like EPS is a reliable tool for estimates when investing? Personally, I think it 100% depends on the company. If we’re talking about V, AAPL, DG or K – yes, I really do think so. If we’re talking about TSLA – Hell. No.
But, as I mentioned earlier, EPS should be nothing more than an additional tool in your tool belt. You shouldn’t start a kitchen renovation with only a hammer, and you shouldn’t start investing only knowing the EPS of a company. I urge you to take the time to really read and understand many of the fundamentals before making an impulse decision that you’ll likely regret.
If you’re like me when I started and you’re wondering where to even begin – listen here. Andrew and Dave have an amazing Podcast that goes really in depth in investing, but they also have an incredible Back to Basics mini-series which is a great spot to learn and understand the fundamentals.
As always, please, invest with a margin of safety – emphasis on the safety!
