Valuing banks, insurance companies, and investment banks are among the more difficult challenges in valuing any business. Most investors opt for relative valuations that use multiples to compare value from one to company to another in large part.
There is nothing inherently wrong with this strategy, but sometimes comparing multiples leads to overvaluation; if the whole sector is expensive, then the company you are comparing, if it is comparable, will be overvalued by comparison.
What if there was a better way? Using models such as a discounted cash flow is problematic because of the nature of financial firms. A dividend discount model is certainly an option, and in many cases, a great one.
But the model I have come to employ, the excess return model, is probably the best of both worlds. It employs measures of value using dividends, the undisputed cash flows of all financial firms, and the cost of equity to produce those cash flows.
If you are unfamiliar with the dividend discount model or the cost of capital, before moving on to learn more about the excess return model, please check out the links below:
Don’t worry; this model is easy to follow once you understand the basics of the above ideas, and it is available for other sectors besides financials.
So if you want to value Microsoft, Apple, or Johnson & Johnson, it will work for them as well. As long as the company pays a dividend, you are welcome to use this model.
In today’s post, we will learn:
- What is an Excess Return
- Basic Excess Return Model
- Inputs to the Excess Return Model
- Examples of the Excess Return Model in Action
Ok, let’s dive in and learn more about the excess return model and how to use it to value companies.
What is an Excess Return?
An excess return, according to Investopedia:
“Excess returns are returns achieved above and beyond the return of a proxy. Excess returns will depend on a designated investment return comparison for analysis.”
In measuring what we are trying to do concerning valuing a financial firm, Excess returns are looking at the returns we can make from our investments.
We identify an excess return by subtracting one investment’s return from the total percentage return we achieve from another investment.
Some investors like to compare their excess returns to a risk-free rate; others may want to compare them to comparable returns they might earn from another investment.
The reasons for utilizing an excess return model are three: because banks, insurance companies, and financial firms present special challenges for investors attempting to value these companies.
The first challenge is that their businesses’ nature makes it difficult to define both debt and reinvestment, making estimating cash flows far more difficult.
The second issue is that they tend to be heavily regulated, and changes in regulatory restrictions can significantly impact the value. The perfect case in point is Wells Fargo, which is currently under a cap restraint from the Fed because of the many ethics issued arising from the fraudulent activities recently occurring at the bank.
The third challenge is the accounting rules that govern bank accounting have historically been very different from accounting rules for other companies, with the assets being marked to market far more frequently for financials.
All the above are reasons for moving towards a dividend discount or excess return model to value financial companies. Using the more traditional discounted cash flow is far more problematic.
Basic Excess Return Model
As we have discovered the difficulty associated with defining a financial company’s total capital, it makes far more sense to focus on the bank’s equity when utilizing an excess return model to value that bank.
The value of the equity in a bank is written as the sum of the equity invested in a bank’s current investments and the expected excess returns that equity investors can expect now and into the future.
One of the more interesting aspects of this model is the focus on excess returns. A financial company that focuses its equity and earns its fair-market rate of return on those investments will see its equity’s market value converge on the equity capital invested that it has invested.
Any bank that earns below fair-market value on its equity investments will see its equity value fall below the equity capital it is currently investing.
The excess return model also considers the future growth of that equity and forecasts those reinvestments’ growth.
The basic formula that we are going to build our model upon is:
Value of Equity = Equity Capital invested currently + Present value of expected excess returns to investors
Let’s move onto the inputs needed to build out our model.
Inputs to the Excess Return Model
There are two main inputs we need to value the equity in an excess return model. The first is the measure of equity capital already invested in the company. The second and more challenging is the expected excess returns to equity in the future.
The first input to the model, equity capital invested currently in the company, is measured as the book value of the equity or the shareholders’ equity listed on the balance sheet.
Nice and easy, huh?
We need to look up the annual or quarterly report for our company and look on the balance sheet for the shareholders’ equity. Voila, we have the equity capital that is already invested in the bank.
To determine the excess returns on that equity is a little more involved but unquestionably doable.
The formula to calculate that return is:
Excess equity return = (return on equity – cost of equity)*(equity capital invested)
To calculate that excess return, we need a few inputs and a bank to use as an example for our simplified model.
The first guinea pig I would like to use is Bank of America (BAC).
So, the first input we need is the return on equity for Bank of America. And to do that, we need the net income and the book value of equity or shareholders’ equity. We can easily go to our favorite financial website and gather the inputs or do it ourselves. I am opting for the do it ourself model.
Looking at the financials for Bank of America, based on the latest 10-k, or you can easily use the TTM (trailing twelve-month) data or the latest quarterly data and multiply by four. Whatever floats your boat, they all get you in the ballpark.
Bank of America’s net income for the year ending 2019 was $27,430 million, and the shareholders’ equity was $264,810 million.
Now to find the return on equity, we simply divide the net income by the shareholders’ equity, or:
Return on equity = 27,430 / 264,810 = 10.35%
Ok, the next input we need is the cost of equity or the CAPM model again; if you are not familiar with this, before moving on, go back to the link at the top of the article.
Inputs for our cost of equity:
- Beta – 1.46
- Risk-free rate – 0.78%
- Equity risk premium – 5.79%
A moment about each of the inputs above, the beta I gathered from gurufocus.com, the risk-free rate is the 10-year Treasury note rate from Treasury.gov, and the equity risk premium is from Damodaran.com
Plugging in the inputs to the cost of equity model, we get:
Cost of equity = 0.78% + 1.46 x 5.79 = 9%
Now that we have our cost of equity let’s calculate how much it costs Bank of America to achieve its equity.
To do this, we take the shareholders’ equity and multiply that by the cost of equity percentage.
Cost of equity = $264810 x 9% = $23,832.90
To determine the excess equity returns that Bank of America earned in 2019, we subtract the end of the year’s net income from our total cost of equity.
Excess equity return = $27,430 – $23,832.90 = $3,597.10
The other section of this model we need to outline is using the return on equity to find the growth of our equity, and for this example, we will stay with Bank of America.
A few additional inputs we will need are:
- Earnings per share – $2.75
- Dividends per share – $0.66
- Return on equity – 10.35%
First, we will find out how much capital Bank of America retains from their retained earnings, and to that, we take the dividends per share and divide that by the earnings per share. Also known as the retention ratio.
Retention ratio = 1 – ($0.66 / $2.75) = 76%
The retention ratio tells us how much Bank of America retains its earnings each quarter or year. The retained earnings get added to the shareholders’ equity in each financial period.
To calculate the retained earnings, we take the dividend payout ratio, which is one minus the retention rate, which is 24%.
Then we find the total amount of dividends paid out from the net earnings of the company. To do this, we multiply the net earnings by the dividend payout ratio.
Dividends paid = $27,430 x 0.24 = $6,583.20
Now, to find what the retained earnings at the end of the year for Bank of America would be:
Retained earnings = beginning net income – dividends paid
Retained earnings = $27,430 – $6,583.20 = $20,846.80
Now, we take those retained earnings and add those to the shareholders’ equity we have been using:
Beginning Equity = $264,810 + $20,846.80 = $285,656.80
And now, we are set up to continue building our model.
Ok, now that we understand the basics of the formula, let’s move on to setting up our model, continuing using Bank of America as our guinea pig.
Examples of the Excess Return Model in Action
Using the inputs we started with, we will continue setting up our Bank of America model and finding the company’s excess return valuation.
To do this, we are going to use a few principles from a discounted cash flow, i.e., we will need to find the present value of the excess returns, plus calculating a growth rate that estimates the growth of net income based on our return on equity and the growing shareholders’ equity.
I will set up the model for two years to see how it works and then expand to ten years.
First, I want to setup calculating the present value of our excess returns; this is important because, at the end of the model, we will add these excess returns up and total them with our beginning shareholders’ equity to find our value of Bank of America.
To do this, we will use a formula from a DCF:
Cost of equity = 1 + cost of equity = 1+9% = 1.09
And we were extending the formula to find the present value of those excess returns we calculated earlier. We take the excess returns and divide them by our cost of equity we just calculated.
Present value of excess returns = $3,592.33 / 1.09 = $3,295.66
To find the next cost of equity extension, we take the following formula:
Cost of equity = (1+1.09)*1.09 = 1.18
And so on, down the line over the years of the model. We will put that together with everything so you can see the extension.
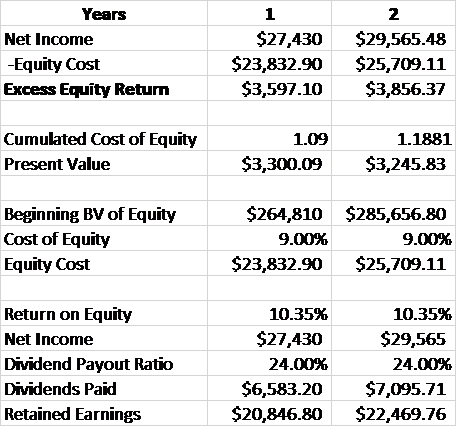
As we can see from the above chart, the formulas we have calculated along the way feeds into finding the present value of the excess equity return of Bank of America.
Now, I will extend these ideas through a period of ten years, which you will see below.

Click to zoomWe need to calculate the terminal year values to add to the present values of the excess returns values. We follow the same methods and formulas from above, but we need to assume a few different inputs.
Without going into the weeds, we assume that our company’s terminal rate will be 3%, based on the country’s GDP growth rate because the company CANNOT grow beyond that rate into the future.
Here are the calculations in the chart for you to see how the terminal value is calculated.
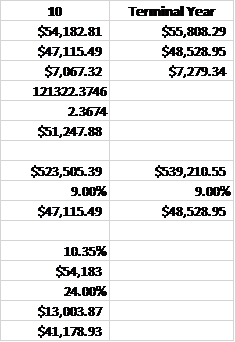
Once we have calculated the excess equity returns for our period, we need to use that data to determine the intrinsic value of Bank of America.
The next step is to add up the present value of those excess equity returns, and then we will add them to our starting shareholders’ equity to find the total value of the equity at the end of the ten years.

Finally, we will divide the equity value by the total shares outstanding we find from the income statement.
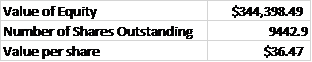
Based on the current market price of Bank of America today, October 21, 2020, of $24.13, the company is undervalued based on the excess returns of equity.
Once we understand the formulas and how they fit together, the idea is straightforward and easy to follow. The hardest part is the ideas, and the inputs are fairly direct.
Let’s take a look at an insurance company to see how this will work. I will give you the inputs and then plug them into the model to show how they fit together.
For our next example, I would like to look at the Principal Financial Group (PFG), and we will use the annual report from 2019 for our data.
Inputs for Principal:
- Net income – $1,394
- Shareholders’ equity – $14,618
- Return on equity – 9.54%
- Earnings per share – $5.00
- Dividends per share – $2.18
- Retention ratio – 56.40%
- Beta – 1.54
- Risk-free rate – 0.78%
- Equity risk premium – 5.79%
- Shares outstanding
We will now plug in the values into our model and give us our intrinsic value for Principal.
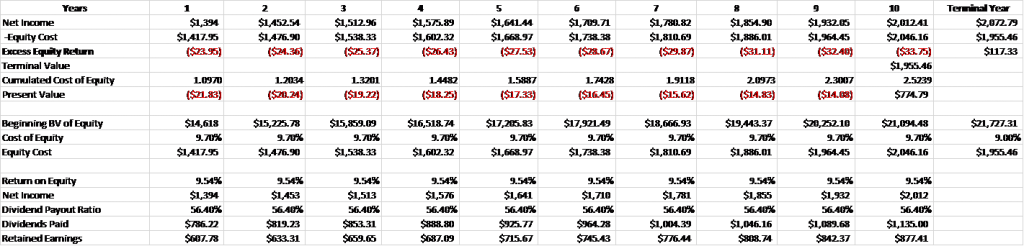
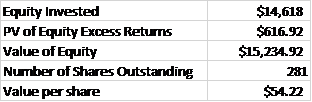
A couple to notice about the model; first, we can see some negative equity, which is a product of the fact that the cost of equity is higher than the return on equity. That will produce negative equity over time and reduce its value if it continues into the future.
You will see that situation from time to time, and it doesn’t mean your model or calculation is wrong; it just means there is a lot of volatility in the share price, which drives up the cost of equity.
Plus, the risk-free rate is abnormally low in this low-interest-rate environment, which offsets the company’s higher beta. Again, not to indicate you are wrong; rather, it is a sign of the times we invest right now.
The current market price for Principal, as of October 21, 2020, is $41.2, indicating that the company is undervalued based on the excess returns the company will earn.
Notes of caution
A couple of ideas to keep in mind when using the excess return model.
The first idea is garbage in, garbage out, which means that the model is only as good as the inputs we feed the model. So we need to be careful what kind of numbers we input into the model, and it only works when we input accurate numbers.
The other idea we need to be conscious of is that no model is a static being; for example, the dividend payout ratio will fluctuate from year to year. Over time, it may rise, which adjusts the final value of the company.
Additionally, the return on equity also moves up and down. One of the ideas that Professor Damodaran builds into his model is adjusting those ideas over time, as he knows that they are not static.
So, suppose we are projecting a return on equity that is higher than their historical performance. In that case, we need to be aware of that when analyzing a company using the model.
That knowledge is an idea that should be considered whenever calculating any intrinsic value of any company.
Remember what Buffett always says; it is better to be approximately correct than precisely wrong. Look for a range of values as opposed to that exact number.
Final Thoughts
Valuing financial companies is always a challenge, and using the excess return model helps lessen that pain. There are other options out there, including the dividend discount model or relative valuations, but the excess return model is a terrific way to find any company’s value.
If you want more info regarding this model, I would strongly suggest you check out Professor Damodaran’s website that offers some great info, including a free spreadsheet that I use for my valuations.
I want to thank Professor Damodaran for so generously sharing his knowledge and his time. I have learned an incredible amount from his teachings, both online and in print. And if you have not checked them out, I would strongly suggest you take a moment to browse the information available.
With that, I am going to wrap up our discussion for today.
As always, thank you for taking the time to read this post today, and I hope you find something of value on your investing journey.
If I can be of any further assistance, please don’t hesitate to reach out.
Until next time, take care and be safe out there,
Dave

Dave Ahern
Dave, a self-taught investor, empowers investors to start investing by demystifying the stock market.
