The Grinold-Kroner model can be used to estimate returns for a single stock, a sector, or the market in general and is a learning from CFA Level III on capital market expectations. Knowing the factors contributing to total expected returns in the Grinold-Kroner model can help investors understand what is driving their returns. In this article, we will introduce investors to the Grinold-Kroner model and use it to get a sense of why total returns for the S&P 500 might be around 4.63% annually over the next 5 years.
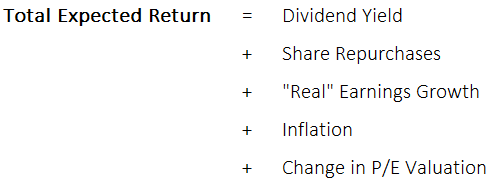
As can be seen below, the main factors contributing to expected returns are dividends, share-buybacks, real earnings growth, inflation, and the change in P/E valuations.
Inputs to the Grinold-Kroner Model
Investors who are familiar with Dividend Discount Models and the Gordon Growth Model will notice some similarities in the Grinold-Kroner model through its use of dividends and growth. However, the Grinold-Kroner model further breaks down the source of the growth between “real” and inflation and also accounts for how net income is being returned to investors through both dividends and share buybacks. Furthermore, the model allows investors to adjust for changes in the valuation of the specific stock or broader market by incorporating the change in P/E valuations expected over the period.
Each input into the Grinold-Kroner model is an estimate subject to its own risks, so it is important to understand where each metric comes from and how much each factor is contributing to total returns. Some of the factors driving returns are interconnected, especially when it comes to valuation levels, so it is important to understand the nuances of each item. Now let’s discuss the specifics of each input.
Dividend Yield:
This is the current dividend yield on the stock or index (before accounting for growth). Dividends are one of the main ways companies return net income to shareholders and are the cash that is getting discounted in dividend discount models.
Share Repurchases:
Share repurchases are continuing to become an important way for companies to return money to shareholders, and the Grinold-Kroner model captures that importance by including it in the total expected return calculation. In fact, since 1997, the amount of money returned to investors through share repurchases has actually been higher than that of dividends.
“Real” Earnings Growth:
Growth can be a significant portion of returns so investors need to be certain to be realistic in their estimates and tailor growth rates to the specific time period. Over a long-term time horizon, it is not plausible for real public corporate earnings growth to be above real GDP growth as this would imply a continually shrinking private economy.
Reliable growth estimates for economies are available from many public sources such as a country’s central bank or the OECD for example. For company-specific growth rates, using an average of sell-side analyst estimates could be a good place to start. Remember that nominal growth includes the effects of inflation but “real” growth is the growth above inflation. Know which figure you are looking at and remember to subtract inflation if necessary.
Side Note: Since we already have included share repurchases, the earnings growth that we want to look at is at a total net income level and not earnings per share, or else we will be double-counting share repurchases.
Inflation:
Companies have the ability to adjust the prices of their products for inflation. This inflation hedge is one of the benefits equities have over bonds. We want to look at inflation by itself to understand what portion of growth is due to the company growing and what is due to overall rising prices in the economy.
While inflation can increase returns, higher inflation also affects risk-free interest rates and the weighted average cost of capital which cash flows are discounted at. This trade-off is reflected in valuation changes as the relative appeal of equities adjusts for the risk-free rate and opportunities available in bonds.
Change in P/E Valuations:
Over the horizon period being analyzed any change in the valuation of the stock or overall market can have a large effect on total returns. For example, if P/E levels are expected to decline from 20x to 16x over the 5 year time period, then this would imply a 20% decrease in valuations (20% = 16x / 20x -1). This change in valuations over the 5 year period would then average out to 4% decreases in valuation per year (4% = 20% / 5 years).
The change in valuation levels can be one of the more subjective estimates in the figure but there are some reasonability checks to make sure things are moving in sync. First off, if growth is expected to slow down, this would suggest that P/E ratios need to decrease to reflect the slower growth. Improving growth rates would imply higher valuation levels might be warranted at the end of the time period. Also, as mentioned before, inflation can effect valuations through the risk-free rate that is used in present valuing cash flows. Higher inflation would generally suggest higher interest rates and lower equity valuations in turn.
Example with the S&P 500
With the S&P 500 sitting at record levels, long-term investors like myself might be anxious to get an idea of what their returns might look like going forward. We will use the Grinold-Kroner model to get an idea of what total returns we might expect and to analyze the breakdown where returns will be coming from. Let’s walk through each metric one by one.
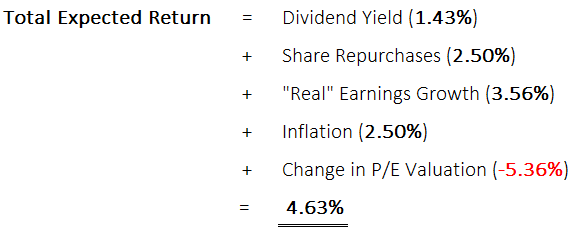
- Dividends: The dividend yield of the S&P 500 is currently around 1.48% if investors were to purchase at today’s prices.
- Share Repurchases: The share repurchase yield will be estimated to be around the 2.50% average over the past couple decades.
- “Real” Earnings Growth: Growth will be high as the economy recovers from COVID-19, and we will use the OECD’s estimate of 5.60% for advanced economies in 2021 as a starting point. However, over the 5-year time horizon, we will assume that this growth rate will return to the long-term average over the past decade of 2.02% to make a simple average of 3.56% annual growth over our 5 year time horizon.
- Inflation: The U.S. Federal Reserve is open to letting inflation run above its 2.0% target in the short-term in order to help output rebound to pre-COVID levels. For our time horizon, we will use a 2.5% average inflation rate.
- Change in P/E Valuations: As many investors know, the market is currently quite expensive with a forward P/E of 22.5x for the S&P 500 as of April 12, 2020. Taking the median forward P/E of 20.9x (in order to avoid high-flying tech outliers in the average), the market is still 26.8% higher than its median 15.3x forward P/E multiple over the past 30 years. A return to this long-term median would imply negative returns of 5.36% annually over our 5 year time horizon due to valuation changes.
Takeaway for Investors
As can be seen in our example, the total expected returns for investors over the next 5 years might be around 4.63% according to the Grinold-Kroner model and our inputs. While a far cry from the double-digit returns investors have seen recently, staying invested in equities should still give investors a far greater return than having their money sitting in their bank account earning next to nil. Even though valuations might fall significantly, the return from dividends, share repurchases, growth, and inflation will more than make up for the valuation decreases.
Related posts:
- The H-Model Discovered – CFA Level 2 As a type of Dividend Discount Model (DDM), the H-Model is a valuation tool that has its core methodology based on discounted cash flows, which...
- How to: Excess Return Model for Valuing Financial Stocks Valuing banks, insurance companies, and investment banks are among the more difficult challenges in valuing any business. Most investors opt for relative valuations that use...
- Explaining the DCF Valuation Model with a Simple Example Updated 9/15/2023 Discounted Cash Flow (DCF) valuation remains a fundamental value investing model. Using a DCF continues as one of the best ways to calculate...
- Building a 3-Statement Financial Model to Estimate a DCF and Intrinsic Value Building a 3-statement financial model is the most detailed way to create a discounted cash flow and estimate a company’s intrinsic value. By having all...


