The Extended DuPont analysis, also known as the 5-step DuPont equation, breaks down the already impressive DuPont model further. For investors, the Extended DuPont analysis is important because it will signify how leveraged a company is to the business cycle, financial markets, as well as government tax policy. Using the DuPont model can allow investors to quickly forecast how earnings might react in different economic and political environments.
The Extended version of the DuPont analysis further breaks down the profit margin by including tax rates and interest expenses separately. These new additions mean the Extended DuPont Analysis has five steps involved in its calculation instead of the standard three steps.
Refresher on the Standard DuPont Equation
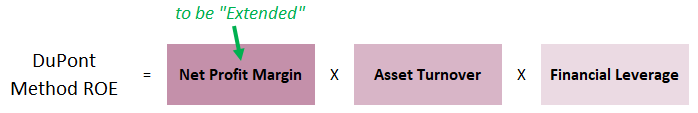
The standard DuPont analysis is a classic tool for any investor’s toolbox as it can really break down a company’s profitability. The DuPont equation breaks a company’s Return on Equity (ROE) down into three core elements: Profit Margin, Asset Turnover, and Financial Leverage. As readers will come to learn, it is not enough to simply say that a company has a high ROE and therefore is a good business. The DuPont method teaches us that it is crucial to understand how the company achieved that ROE through dissecting its components.
The name for the method originates from its creation in 1912 by Donaldson Brown while he worked at DuPont. The formula’s strengths and mathematical precision give many accountants and financial analysts a strong admiration for the formula and its young creator. Readers can check out our standard DuPont formula article for more details on its calculation and interpretation.
The “Extended” 5-Step DuPont Equation
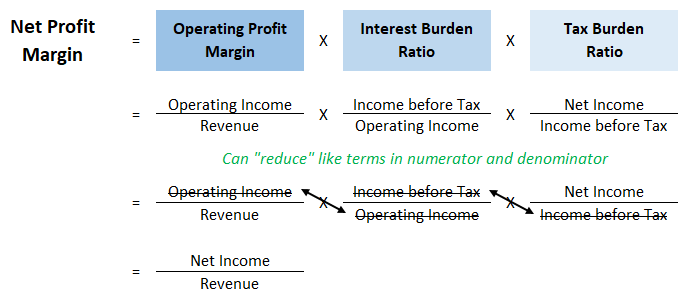
The Extended version of the DuPont analysis further breaks down profit margin by taxes and interest expenses. This allows investors to get a sense of the components driving the important net profit figure. The below calculation now done in three steps instead of one replaces the net profit margin figure in the above formula.
The Extended DuPont equation breaks net income down into operating margin, the interest burden ratio, and the tax burden ratio. As can be seen in the formula below, the additional pieces of the equation equal the standard net profit margin figure that we are replacing. To make this relationship clear, we have shown the variables being canceled out in cross multiplication.
All of the financial metrics in the Extended DuPont equation are key to a company’s profitability and are measured within the IFB Equity Model. Each of these metrics can be tracked and forecasted when doing a company valuation to understand where profits are being created. The IFB Equity Model is one of the courses and spreadsheets available on the IFB products page and allows users to easily value a company. The model is fully customizable using six different techniques that grab data automatically from forecasted 10-year financial statements.
Operating Profit Margin (EBIT / Revenue): Operating profit is the company’s core earnings power before taking into account capital structure and taxes. A higher operating profit margin compared to competitors in the industry would indicate efficiency in operations and a greater ability to turn revenue into income. If the company has superior or sub-par operating profits, it would be worthwhile investigating what part of its operations might be driving that.
It should be noted, especially because we are breaking down the standard DuPont equation, that operating profit margin can be broken down further into both variance and fixed costs. The analysis is termed Degree of Operating Leverage and could be used to understand a company’s income sensitivity to changes in revenue and volumes.
Interest Burden Ratio (EBT / EBIT): The Extended DuPont model takes a company’s interest burden into account by seeing what portion of earnings before interest and tax (EBIT) is left over after interest is deducted to arrive at earnings before tax (EBT).
With interest rates doubling in 2022 compared to the last couple of years, companies are going to see their costs of financing rise. Investors can price this in by adjusting the interest burden rate by the expected increase in the company’s borrowing cost. The weighted average maturity of a company’s debt outstanding which will need reissuance as well as the mix of floating versus fixed interest rate debt should be available in their financial statements and annual reports.
Tax Burden Ratio: (Net Income / EBT): Tax rates will vary across countries and are always a significant part of the net income picture. If a country is going through a tax policy change, investors can use this part of the Extended DuPont equation to price in the expected effect on net income margins and ROE.
Furthermore, analyzing the tax burden ratio can be a great tool for investors with environmental, social, and governance (ESG) considerations. Looking across firms in the same industry and country, investors can get an idea about how aggressive companies are being with their tax footprint. This can also help investors make good long-term decisions as tax rates continue to adapt and unify worldwide with minimum levels.
Putting the Extended 5-step DuPont Together
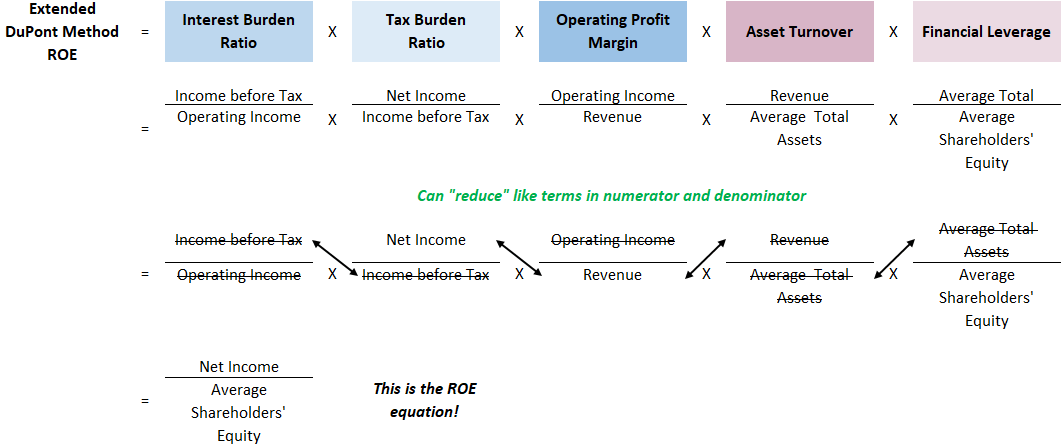
Now that we have broken down the drivers of net profit margin into 3 separate ratios, we can lay out the new 5-step Extended DuPont formula. As can be seen below, the 5-steps of the DuPont method cross multiply into the return on equity formula. The various components of the DuPont analysis can be viewed historically in a time series analysis to identify trends and averages to be used in forecasting.
Takeaway for Investors
Analyzing a company’s return on equity through the DuPont method can give investors insights into how the company will be affected by changing economic, government tax policy, or financial market conditions. The Extended DuPont method further breaks down the already impressive 3-step standard DuPont model by considering how operating income, taxes, and interest expenses come together to form the company’s net income.
