Updated 4/6/2023
FCF margin is a valuable tool for understanding how much free cash a company can generate from its revenues. In general, a higher FCF (Free Cash Flow) margin means a company doesn’t need to spend much money to create profits and free cash.
Click to jump to a section:
- Why is FCF Important?
- What is FCF (Free Cash Flow)?
- What is FCF Margin?
- What is a Good FCF Margin?
- High ROIC vs FCF Margin = Potential Cash Flow
- Lower ROIC than FCF Margin: Potential Cash Hoarder
- Investor Takeaway
Why is FCF Important?
Free cash flow is the amount of real cash available to a company after it pays all of its expenses (labor, manufacturing, taxes) and makes its long-term capital investments (offices, stores, or factories).
FCF is different from earnings (Net Income) because earnings include depreciation. Earnings are supposed to give a more accurate representation of a company’s true earning power from year to year.
For example, take a company that makes $1 billion in profits but spends $6 billion on a factory in the same year. The company didn’t really lose -$5 billion for the year because that factory was more of an investment than a yearly operating expense.
Accountants smooth the earnings by depreciating the expense over the life of the asset. Essentially, this charges it against earnings over a long period of time rather than all at once.
It makes earnings more comparable from year to year, and this is why depreciation as an accounting metric can be valuable.
But, the real cash flow situation of the business was indeed -$5 billion.
To represent the real cash flow of a business, we use FCF. FCF helps us understand how much a company must spend every year to expand or maintain the business. These expenditures take the form of term investments such as factories, stores, or IT equipment.
What is FCF (Free Cash Flow)?
The basic definition for FCF is generally:
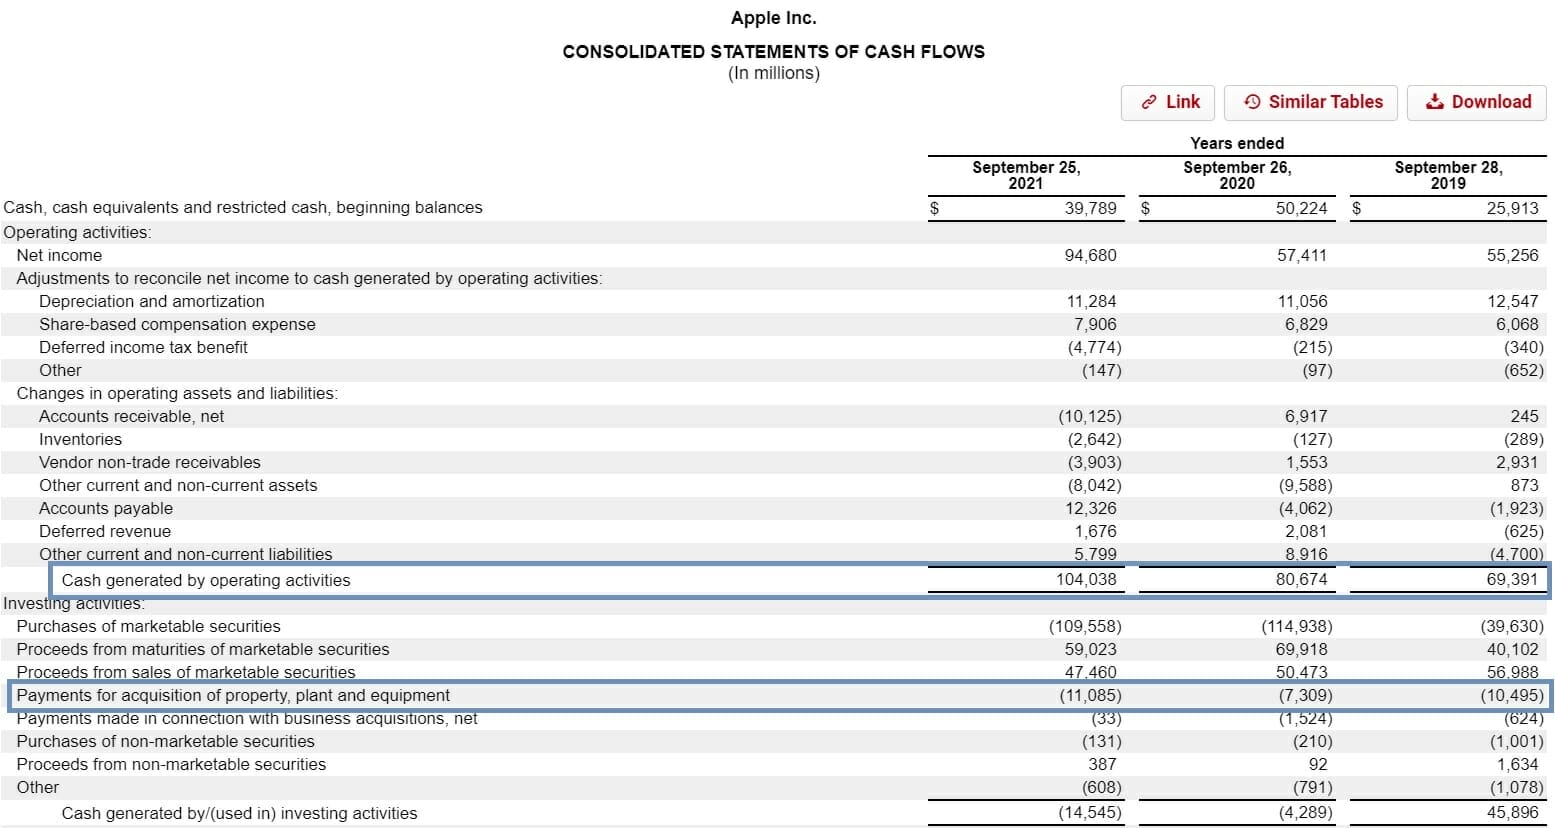
FCF = Cash from operations – capital expenditures
You can find both cash from operations and capital expenditures in the cash flow statement of a company’s 10-k. Example from Apple’s 10-k:
What is FCF Margin?
Free cash flow margin simply takes the FCF and compares it to a company’s sales (or revenue).
This is helpful in comparing the free cash situation of different companies on an apples-to-apples basis. By tying FCF to a percentage of sales, we can understand the margins profile and get context on how efficient a company is on an FCF basis. The formula is as follows:
FCF Margin = FCF / revenues
Similar to other margin ratios, the FCF margin formula returns a percentage value, with a higher number indicating a higher percentage of revenues converting to FCF (or not).
You can compare FCF margin to other commonly used margins such as:
- Gross margin (Gross Profit / Revenue)
- Operating margin (Operating Income / Revenue)
- Net margin (Net Income/ Revenue)
Generally, if a company is very capital intensive, it might have a FCF margin much lower than its Net Margin level.
On the flip side, a very capital efficient business could have a much higher FCF margin than its Net Margin, especially if it is a cash cow.
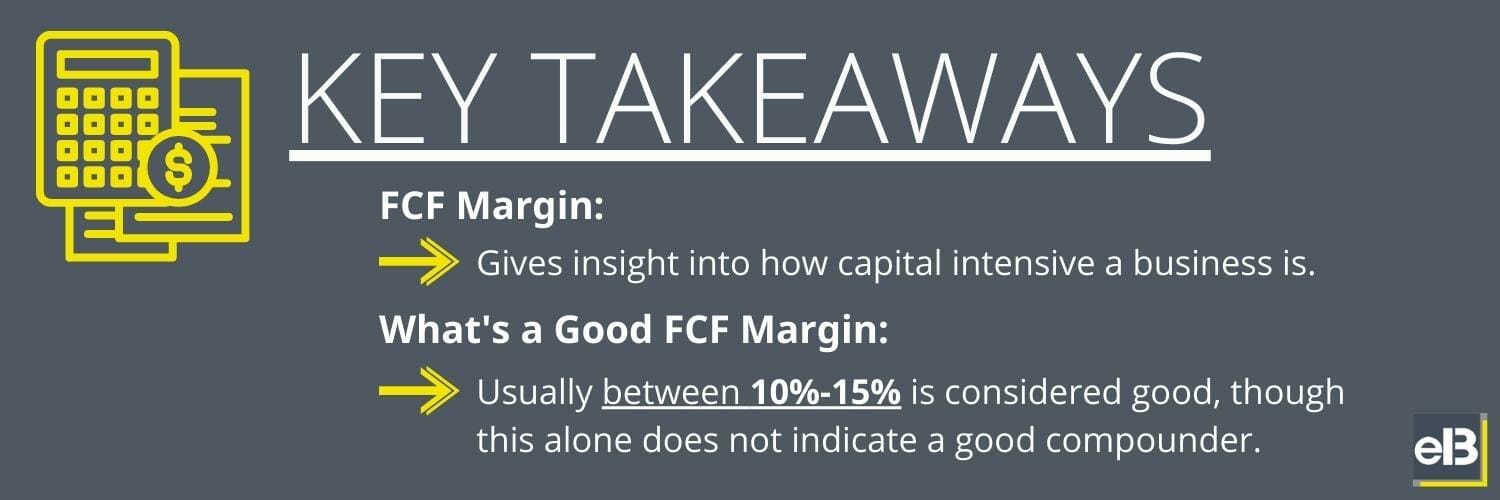
What’s a Good FCF Margin?
As another general rule, an FCF margin of 10%- 15% is usually considered pretty good. This range sort of splits the line between a capital-efficient business and a capital-intensive business.
That’s not to say that all companies with low FCF margins are necessarily bad.
We’ve had plenty of highly capital-intensive businesses that have performed very well in the stock market. To name a few– Exxon Mobil during its heyday and retailers with slim margins like Walmart or Amazon.
High FCF margin businesses tend to be preferred because the lower capital intensity usually means that it’s easier to scale a business—since it doesn’t need much capital to do so.
But the reality is that there are always other factors in play when it comes to growth. Companies with high FCF margins can have their own difficulties in finding growth, especially if their target market is smaller.
Whether an FCF margin is good or not depends on the context, the individual business, its industry, and more.
Analyzing FCF Margin With Return on Invested Capital (ROIC)
Comparing FCF margin with another key efficiency ratio, like ROIC, can also help provide context on the capital allocation skills of management.
Like with FCF margin, investors generally like to see high ROIC companies. These types of businesses have tended to command a premium compared to the overall market, especially leading up to 2022.
Understanding the relationship between ROIC and FCF margin can really help investors truly grasp the usefulness and application of FCF margin.
Before starting, here’s the basic formula for ROIC:
ROIC = NOPLAT / Invested Capital
Where,
NOPLAT = Net Operating Profit Less Adjusted Taxes
and
Invested Capital = Working Capital + Long Term Assets
When I refer to ROIC in this post, I’m referring to operating ROIC, and you can read more about this important distinction (with full definitions) here.
High ROIC vs FCF Margin = Potential Cash Cow
Both ROIC and FCF yield tend to serve as good proxies for measuring how efficient a company is with its cash.
What I’ve noticed looking at long-term averages of FCF margin and ROIC is that these tend to converge close to each other. Many high-margin, asset-light businesses will tend to have high returns on invested capital and vice versa.
But there are times where it isn’t.
In particular, you might notice that a company has a much higher ROIC than its FCF margin and wonder how that is possible.
Rather than keep you in suspense forever, I’ll just tell you: it’s probably a cash cow.
Many times companies with high FCF margins will have critical capital allocation decisions to make. They don’t want to waste that free cash flow on expensive projects that don’t return a lot (low ROIC), so they have a quandary.
Say you’re a CEO. If you have a pile of company cash, and there’s no good, high ROIC projects to put it into, you could either:
- Waste it on low ROIC projects, and lower future ROIC
- Keep the cash on the balance sheet, which lowers ROIC
- Return the capital to shareholders
Turns out that option 3 takes the best of both worlds as long as a company can maintain a sufficient growth rate over time.
When a company returns capital to shareholders, whether through a dividend or share buyback, this reduces the invested capital and keeps ROIC high.
Shareholders like it too because it increases total return.
Of course, a company can’t just return all their cash back to shareholders because then the free cash flow itself doesn’t grow. If management doesn’t reinvest back into the business, it can allow competitors to steal market share.
It takes a delicate balance between investing in growth and returning capital to shareholders to keep a high ROIC.
Here are a few examples of companies with high ROIC vs their FCF margin (from 2011-2020):
- Mastercard ($MA) = 101.4% ROIC, 40% FCF Margin, -21.4% shares outstanding
- Nike ($NKE) = 28.2% ROIC, 7.9% FCF Margin, -19.4% shares outstanding
- Home Depot ($HD) = 26.6% ROIC, 8.5% FCF Margin, -35.2% shares outstanding
- Intuit ($INTU) = 43.4% ROIC, 31.0% FCF Margin, -18.8% shares outstanding
The large reductions of shares outstanding indicate that these companies returned lots of cash to shareholders– through buybacks.
Lower ROIC than FCF Margin: Potential Cash Hoarder
What about when a company has a higher FCF margin compared to its ROIC? Is it an anti-cash cow?
Remember that ROIC and FCF margins tend to work hand-in-hand with each other, and over the long term, these metrics tend to converge.
But, it all depends on the capital allocation decisions of a CEO, and these decisions can make long-term ROIC much higher than FCF margin (cash cow), or much lower (not necessarily bad).
It’s not that we, as investors, want to see one metric over the other.
Rather, we should look at a company’s relationship with its ROIC and FCF margin and see if it makes sense for that particular business.
Take a company in a high-growth technology industry as an example. Assuming the company doesn’t have a strong competitive advantage, it’s probably foolish for that company to act like a cash cow because:
- Technology innovation moves very fast
- Without a technological moat, this quick innovation can allow competitors to easily swoop in and steal market share (lowering growth and long-term ROIC and FCF margin)
What about the opposite side of the fence, where ROIC is much lower than its FCF margin?
Well, simply, it means that they have been stockpiling cash (or working capital).
When you calculate Invested Capital for ROIC, you should be including PPE and goodwill (long-term assets that require the use of FCF through capex or acquisitions), and adding working capital.
We noted how these relationships between FCF and PPE/goodwill will cause ROIC and FCF margins to converge.
But in the case that working capital shrinks (through buybacks and dividends) the ROIC goes higher, and if it expands (through cash or inventories, etc), the ROIC goes lower—all else remaining equal.
We want to still see growth of free cash, revenues, etc, when ROIC changes like this—but again, as long as it makes sense for the business, then either higher ROIC or higher FCF margin can be a good thing to see.
Let’s look at a few great businesses with these characteristics (comparing their median ROIC over the last 10 years with their median FCF margin):
- Facebook (FB) = 17.7% ROIC, 33.2% FCF Margin
- Microsoft (MSFT) = 23.5% ROIC, 31.3% FCF Margin
- Visa (V) = 20.8% ROIC, 44.5% FCF Margin
- Cisco (CSCO) = 12.6% ROIC, 24.9% FCF Margin
What these companies are telling us—in their decisions to hoard capital rather than make expensive acquisitions, capex, or return it to shareholders—is that they are biding their time for the right investment opportunities, or their stocks are too expensive for share buybacks, or both.
Maybe they see acquisition targets as too expensive, or expansion capex as wasteful… or they could simply be accumulating capital to make a huge splash soon.
As investors, you want to try and evaluate the company’s place in its industry and try to understand why they are hoarding this cash rather than returning it to shareholders and if it’s indicative of a long-term pattern or it’s just a short-term development.
Investor Takeaway
FCF margin can be a valuable tool in helping to understand the capital structure of a business, especially how capital-intensive or capital-light it generally is.
But, you should never rely on just one metric to make a judgment on a business.
I think a broad education on all 3 financial statements– income statement, balance sheet, cash flow statement— is what you need to help understand how to better analyze companies.

Andrew Sather
Andrew has always believed that average investors have so much potential to build wealth, through the power of patience, a long-term mindset, and compound interest.
