The DSO acronym in finance stands for average days sales outstanding, and is critical to understanding a company’s revenue and sales trends. The DSO calculation is simple, yet its usefulness should not be glossed over.
Using the DSO formula can help a financial analyst spot when a company could be “stuffing the channel”, leading to unsustainable aggressive accounting techniques or even outright fraud.
Calculating days sales outstanding can also assist in finding companies whose sales trends are starting to falter, as the number of days it takes to collect an accounts receivable is a direct signal that customers are either:
- Receiving favorable collections terms
- Having trouble paying off their vendors
Either of those customer situations don’t bode well for the company to whom receivables are owed, as a continued trend such as these both lead to the same thing, a decrease in future revenue.
In this post, we will learn [Click to Skip Ahead]:
- How to Calculate Days Sales Outstanding (DSO)
- Example of Using the DSO Formula to Find Aggressive Accounting
- DSO Calculation Example using a Real-Life 10-k
- Average DSO By Industry [for the S&P 500]
Let’s start with the DSO calculation (there are two).
How to Calculate DSO
Like I mentioned, the DSO calculation itself is pretty simple. There are two variations:
- A quarterly DSO calculation
- An annual DSO calculation
In each case, it’s prudent to compare YOY trends with historical data. Also, comparisons to competitors can also be helpful, but be mindful that you are comparing apples-to-apples.
Quarterly DSO (Days Sales Outstanding) Formula
= 91.25 * (Accounts Receivable / Quarterly Revenue)
Annual DSO (Days Sales Outstanding) Formula
= 365 * (Accounts Receivable / Annual Revenue)
The numbers in the formulas are selected based on the average number of days in each time period (quarterly or yearly).
According to revenue recognition expert John Del Vecchio, CFA, even a small change in DSO could indicate aggressive revenue recognition, or future revenue problems.
From his classic book he co-authored called What’s Behind the Numbers? :
“In John’s experience, even just a few days year-over-year increase in DSO can signal poor earnings quality and potential trouble ahead”.
How Changes in DSO Can Detect Aggressive Accounting (historical example)
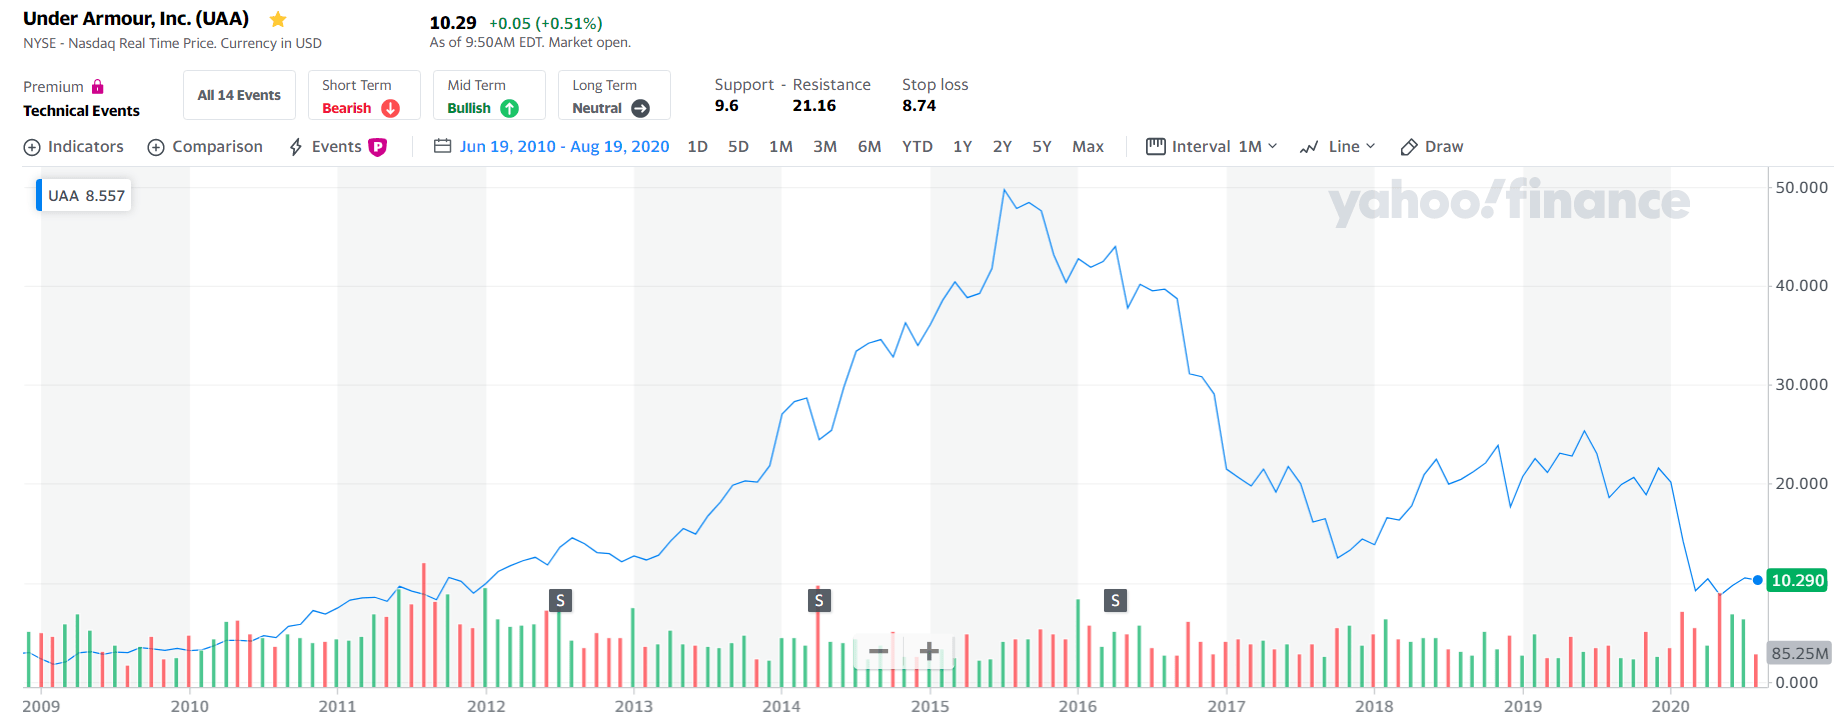
Consider Under Armour ($UAA), a classic case of a company whose strong consecutive revenue growth came to a crashing halt, and how much the trends in DSO mirrored the stock (and business’s) performance.
Here’s a screenshot of the company’s ticker over the last 10 years:
The annual trends in DSO can also be sourced quite easily from company financial reports, also displayed here:
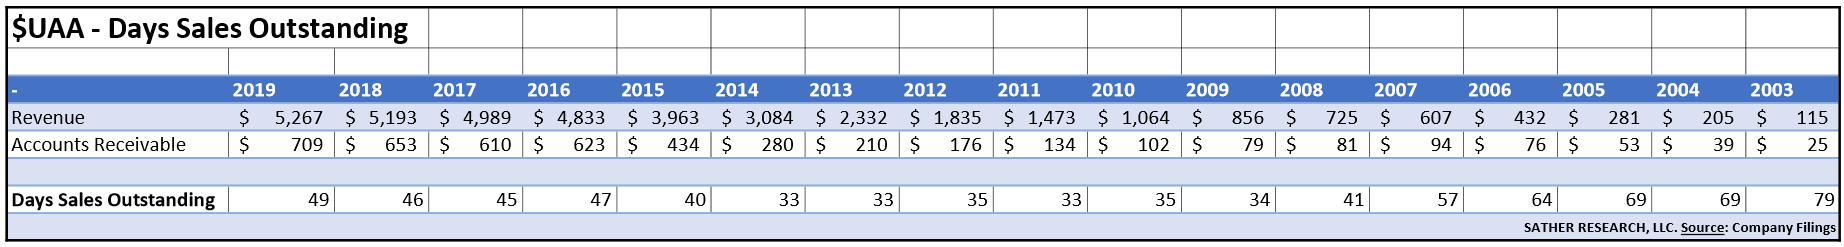
Click to zoomYou can see that from 2003 until 2014, the DSO formula found itself in a steady decrease, as revenues grew from $115 million to $3,084 million over the same time period.
But in 2015, average Days Sales Outstanding increased sharply from 33 days to 40 days, and then from 40 to 47 days, and has stayed around this level ever since—in stark contrast to its former historical average of the mid 30’s during its booming times in the early 2010s.
Since 2015, revenues have continued to increase but at a much slower pace, and the company has not been profitable in 2 of the 4 years from 2016-2019 on a Net Income basis. Operating profits have also sharply declined since 2016 and are mere fractions of the levels achieved in 2015 and 2016 (from the 400s (million $USD) to the 150-200s (million $USD).
Investors who saw the annual increase in DSO from 33 to 40 as reported in the 10-k could’ve sold the stock around $42, before the stock’s colossal crash down to today’s value of $10.
DSO Calculation (Real-Life Example)
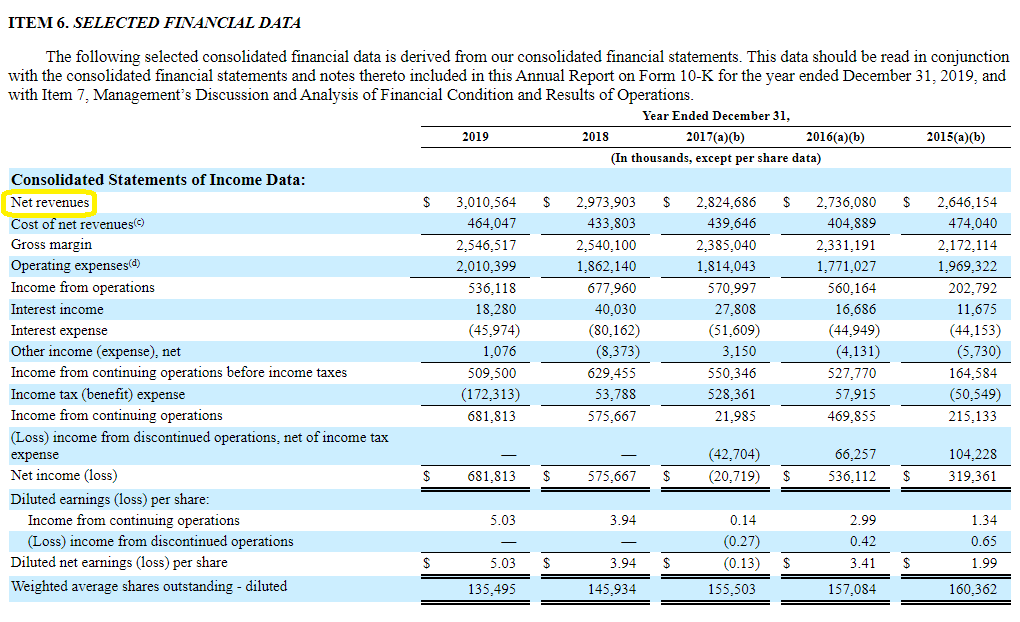
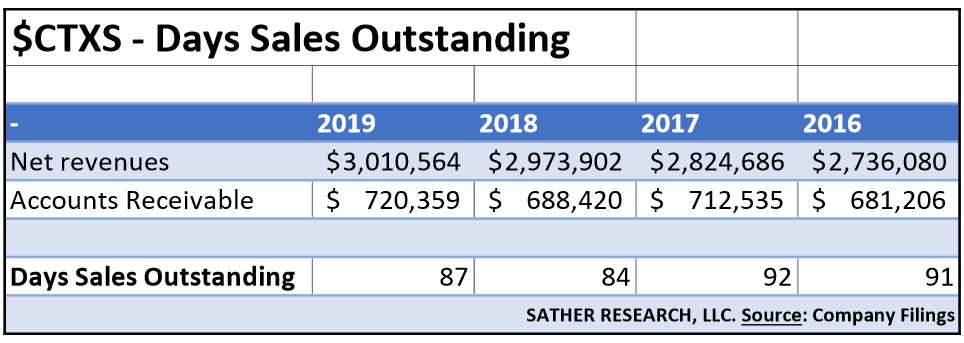
Now I will take a software company, Citrix Systems ($CTXS), and pull up their latest 10-k to look at their days sales outstanding over the last 4 years.
From Item 6: Selected Financial Data, we can see the total revenue over the last 5 years:
From the Consolidated Balance Sheets, we can find Accounts Receivable:
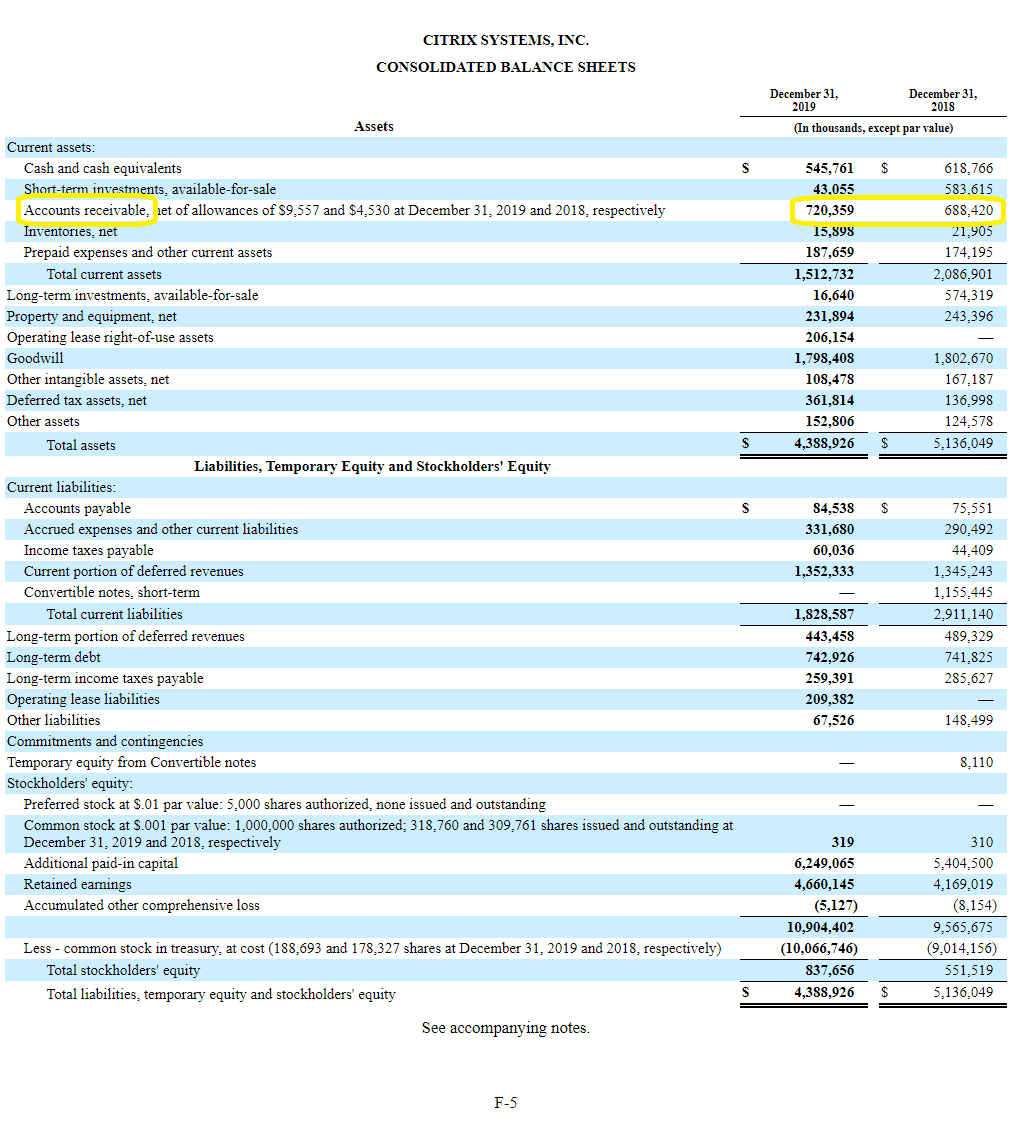
Using the DSO formula described above, we can calculate annual Days Sales Outstanding for 2019 in this way:
= 365 * (Accounts Receivable / Annual Revenue)
= 365 * (720,359 / 3,010,564)
= 87.33 days
Taking these data points and inputting them into a simple spreadsheet, we find the DSO calculation for $CTXS as the following:
With the company’s announced transformation from a focus on perpetual licenses to subscriptions, the impact to Days Sales Outstanding and Revenue Recognition moving forward will be something to monitor closely.
Comparing trends with companies who have historically undertook similar transformations, particularly in the software space, could be quite beneficial in understanding this special case.
Average DSO by Industry [S&P 500]
To come up with the DSO calculations for the entire S&P 500, I used the time period for fiscal years 2018/2019, in an attempt to exclude distortions from the latest crisis from the pandemic.
You can see a summary for the average DSO of the S&P 500 by industry here:
| Industry | Avg DSO |
|---|---|
| Aerospace & Defense | 71 |
| Air Freight & Logistics | 55 |
| Airlines | 14 |
| Auto Components | 70 |
| Automobiles | 116 |
| Beverages | 47 |
| Biotechnology | 69 |
| Building Products | 61 |
| Capital Markets | 72 |
| Chemicals | 74 |
| Commercial Services & Supplies | 50 |
| Communications Equipment | 73 |
| Construction & Engineering | 91 |
| Construction Materials | 45 |
| Containers & Packaging | 53 |
| Distributors | 42 |
| Diversified Consumer Services | 16 |
| Diversified Financial Services | 57 |
| Diversified Telecommunication Services | 63 |
| Electric Utilities | 47 |
| Electrical Equipment | 62 |
| Electronic Equipment, Instruments & Components | 63 |
| Energy Equipment & Services | 102 |
| Entertainment | 42 |
| Equity Real Estate Investment Trusts (REITs) | 42 |
| Food & Staples Retailing | 11 |
| Food Products | 31 |
| Gas Utilities | 30 |
| Health Care Equipment & Supplies | 66 |
| Health Care Providers & Services | 44 |
| Health Care Technology | 80 |
| Hotels, Restaurants & Leisure | 21 |
| Household Durables | 35 |
| Household Products | 34 |
| Independent Power and Renewable Electricity Producers | 47 |
| Industrial Conglomerates | 74 |
| Insurance | 166 |
| Interactive Media & Services | 64 |
| Internet & Direct Marketing Retail | 46 |
| IT Services | 105 |
| Leisure Products | 95 |
| Life Sciences Tools & Services | 71 |
| Machinery | 99 |
| Media | 86 |
| Metals & Mining | 25 |
| Multiline Retail | 2 |
| Multi-Utilities | 61 |
| Oil, Gas & Consumable Fuels | 45 |
| Personal Products | 57 |
| Pharmaceuticals | 79 |
| Professional Services | 59 |
| Real Estate Management & Development | 92 |
| Road & Rail | 39 |
| Semiconductors & Semiconductor Equipment | 53 |
| Software | 78 |
| Specialty Retail | 8 |
| Technology Hardware, Storage & Peripherals | 65 |
| Textiles, Apparel & Luxury Goods | 39 |
| Tobacco | 25 |
| Trading Companies & Distributors | 56 |
| Water Utilities | 52 |
| Wireless Telecommunication Services | 36 |
Excluding the 30+ companies with no data, I found that the average Days Sales Outstanding (DSO) for the entire S&P 500 was 62 days in the time period examined, with the median DSO at 55 days.

Andrew Sather
Andrew has always believed that average investors have so much potential to build wealth, through the power of patience, a long-term mindset, and compound interest.
