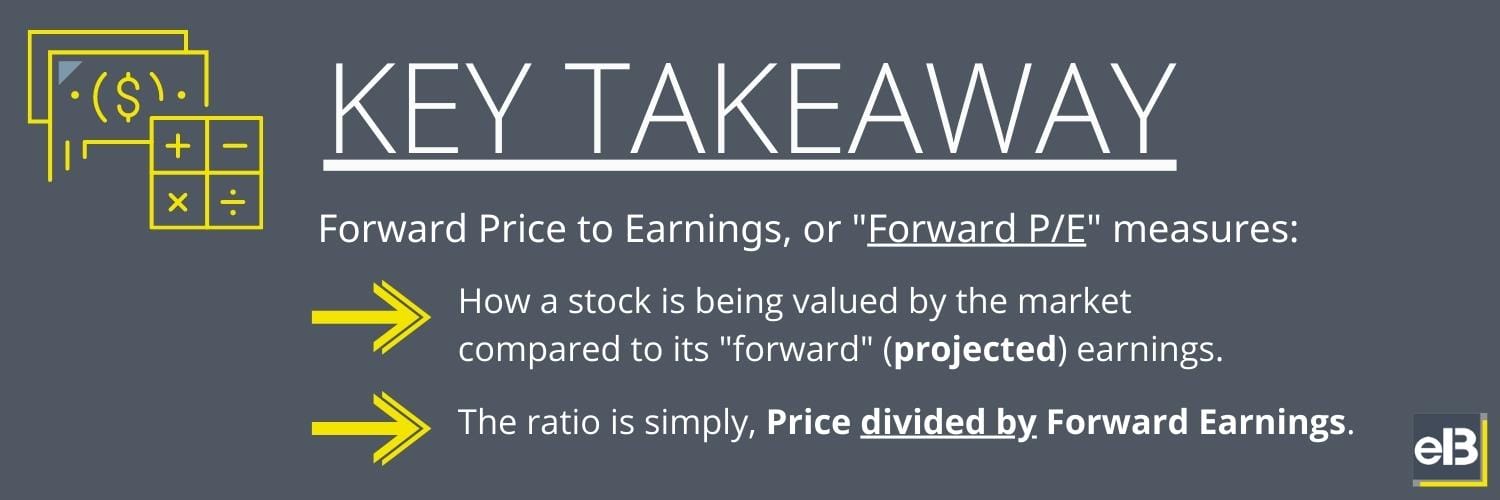
Forward Price to Earnings, or Forward P/E, is an easy ratio for estimating how expensive a stock is compared to its projected (“forward”) earnings.
Similar to the Price to Earnings (P/E) ratio, it gives investors an apples-to-apples comparison for every stock in regards to its profitability (earnings) and stock price.
The P/E is a common metric found on financial websites for stocks.
Some websites will show both a company’s current P/E ratio and forward P/E ratio, while some might use a company’s forward P/E ratio to describe a company’s P/E.
In other words, investors should know that some websites are referring to a company’s forward P/E when they display a P/E ratio—so it’s a good ratio to also understand.
This post will cover the basics, pros and cons, and common FAQ on the Forward P/E (or Price to Earnings) ratio.
Forward Price to Earnings (P/E) Formula
Like mentioned in our P/E Valuation Guide linked above, Price-to-Earnings is a simple formula described by the following:
P/E = Price / Earnings
You can find this out easily on any stock by taking its stock price (per share) and dividing it by its Earnings Per Share:
P/E = Stock Price / Earnings Per Share
The Forward Price to Earnings formula takes the same formula but makes a slight modification, like so:
Forward P/E = Price / Forward Earnings
Forward P/E = Stock Price / Forward Earnings Per Share
So what is Forward Earnings?
Forward Earnings refers to the earnings that a company is expected to generate in the next twelve months.
Analysts on Wall Street will project a company’s future earnings, usually at least 12 months out, and the consensus on these projections will make up the Forward Earnings (and Forward Earnings Per Share) for a stock.
Analysts may use various factors in projecting future earnings, such as:
- Historical earnings
- The guidance for future earnings from the company’s management
- The guidance for future earnings from competitors’ managements
- Projections or recent statistics for other relevant factors (unemployment, interest rates, etc)
- The projections from other analysts
That’s right—forward earnings comes full circle because analysts will often use each other’s estimates to create their own estimates.
So even though an analyst may feel a company’s future earnings are much higher or lower than consensus, they tend to anchor their estimates to the consensus and don’t depart from it too much.
This leads to future earnings being a “group think” estimate, which has its own pros and cons (along with the pros and cons of Price to Earnings in general).
Forward Price to Earnings: Pros and Cons
Forward P/E: Cons
Unfortunately, on Wall Street and Main Street, forward projections are often wildly wrong.
Take the example of professional economists who try and predict future GDP at the beginning of every year. Economists can often be wrong, and especially during “black swan” events.
What makes forward projections interesting is that the magnitude that they are wrong can become very high.
In the real world, economic results don’t move up in a straight line.
There can be huge peaks and valleys from unpredictable events; take the pandemic as an easy example, where U.S. GDP went -3.4% in 2020 only to rebound by +10.1% in 2021. These GDP growth numbers deviate wildly from recent trends—that phenomenon happens more than we think.
A very similar thing happens with companies in the stock market.
Earnings can be lumpy over time rather than moving in a straight line for most companies, and so analysts’ estimates can be very wrong during these periods.
If you are using only forward earnings estimates to determine if a stock is expensive or cheap, you can be wrong (very wrong) in that estimate and have the stock’s future performance go in a way you didn’t expect.
Research on analysts’ estimates for forward earnings show that they have been consistently overoptimistic, so you might be more wrong than you are right if you only rely on forward price to earnings ratios.
Forward P/E: Pros
Price to earnings, in general, is a great metric to allow you to sift through many stocks in a short time period.
You can group stocks in an easy way to try and quickly eliminate those that are likely extraordinarily overvalued (which also happens more than we think).
For example, you could decide to only look at stocks with forward P/E’s in the 10-25 range and ignore those in the 50-100 range. This can save lots of time in helping you avoid those stocks that are most likely expensive even if analysts are too pessimistic on future results.
Using forward earnings is also beneficial in the case that a company’s earnings are temporarily out-of-line with long term reality.
The pandemic was again another good example of this.
Companies with highly depressed earnings in 2020 that were expected to see an earnings rebound in 2021 had super high P/E ratios for 2020 but much lower forward P/E ratios for 2021.
If you were looking at some stocks in 2020, using only their trailing P/E was not a good indicator because of the temporary nature of those 2020 earnings, and using the forward P/E was a better idea. Again, that was for some companies.
Should I Use Forward or Trailing P/E?
Which leads to the next part of the discussion about forward price to earnings… is forward P/E better than trailing P/E?
Like I mentioned in the “pros and cons” section—it depends.
Trailing P/E refers to a company’s trailing twelve months (TTM) earnings, instead of its future (projected) earnings.

This can be a much preferred method because a company’s trailing earnings are not in debate; these are cold, hard facts.
That said, a stock’s performance depends on what a stock does moving forward, and not necessarily what it’s done already.
A great quote (not sure from whom) encapsulates this:
Past performance does not guarantee future results.
As investors trying to make sense of forward and trailing Price to Earnings, we have to remember that there are benefits to looking at the past (reliable numbers) and the future (determinant of performance). But also, there are real downsides to looking at the past (no regard to expectations) and the future (uncertain).
It’s very similar to the P/E ratio itself, which has its own pros and cons.
If you’re using P/E’s, you should probably look at both trailing and forward P/E, but within the context of what that formula can describe, and what it can’t.
What’s a Good Forward P/E Ratio?
In general, a good Forward P/E ratio has the same ranges as a good P/E, between 10-25 is a good P/E for most stocks.
This is because stocks with a Forward P/E below 10 can often be a value trap, and those above 25 can often be too expensive because they are priced with unreasonably high growth expectations.
But we can’t paint P/E’s too broadly like this, because P/E’s are affected by many factors:
- Earnings growth
- Interest rates
- Return on capital
- Investor sentiment
Some factors affect certain stocks more than others.
For example, stocks in high growth industries tend to be affected much more by changes in investor sentiment and interest rates, while stocks in more matured industries tend to be affected much more by changes in earnings growth and return on capital.
There are many arguments for why you should want higher forward P/E ratio stocks or lower forward P/E stocks; that’s why it’s hard to paint with a broad brush and be successful.
Remember that Forward Price to Earnings is simply a tool in your kit; ideally you have many tools to help you analyze a stock.
How Do You Find a Stock’s Forward P/E Ratio?
Here’s the easy part.
You can find a stock’s forward P/E in a myriad of ways, and I will show you two. First, we can look at a website like finviz to see both Trailing P/E and Forward P/E for any stock in seconds.
Starting from the homepage, type in a company’s stock ticker in the search bar to pull up the summary for a company’s main financial figures. In my case I want to see Microsoft (ticker: MSFT).
Here’s a screenshot of that, with highlights for where the company’s Trailing P/E and Forward P/E are displayed:
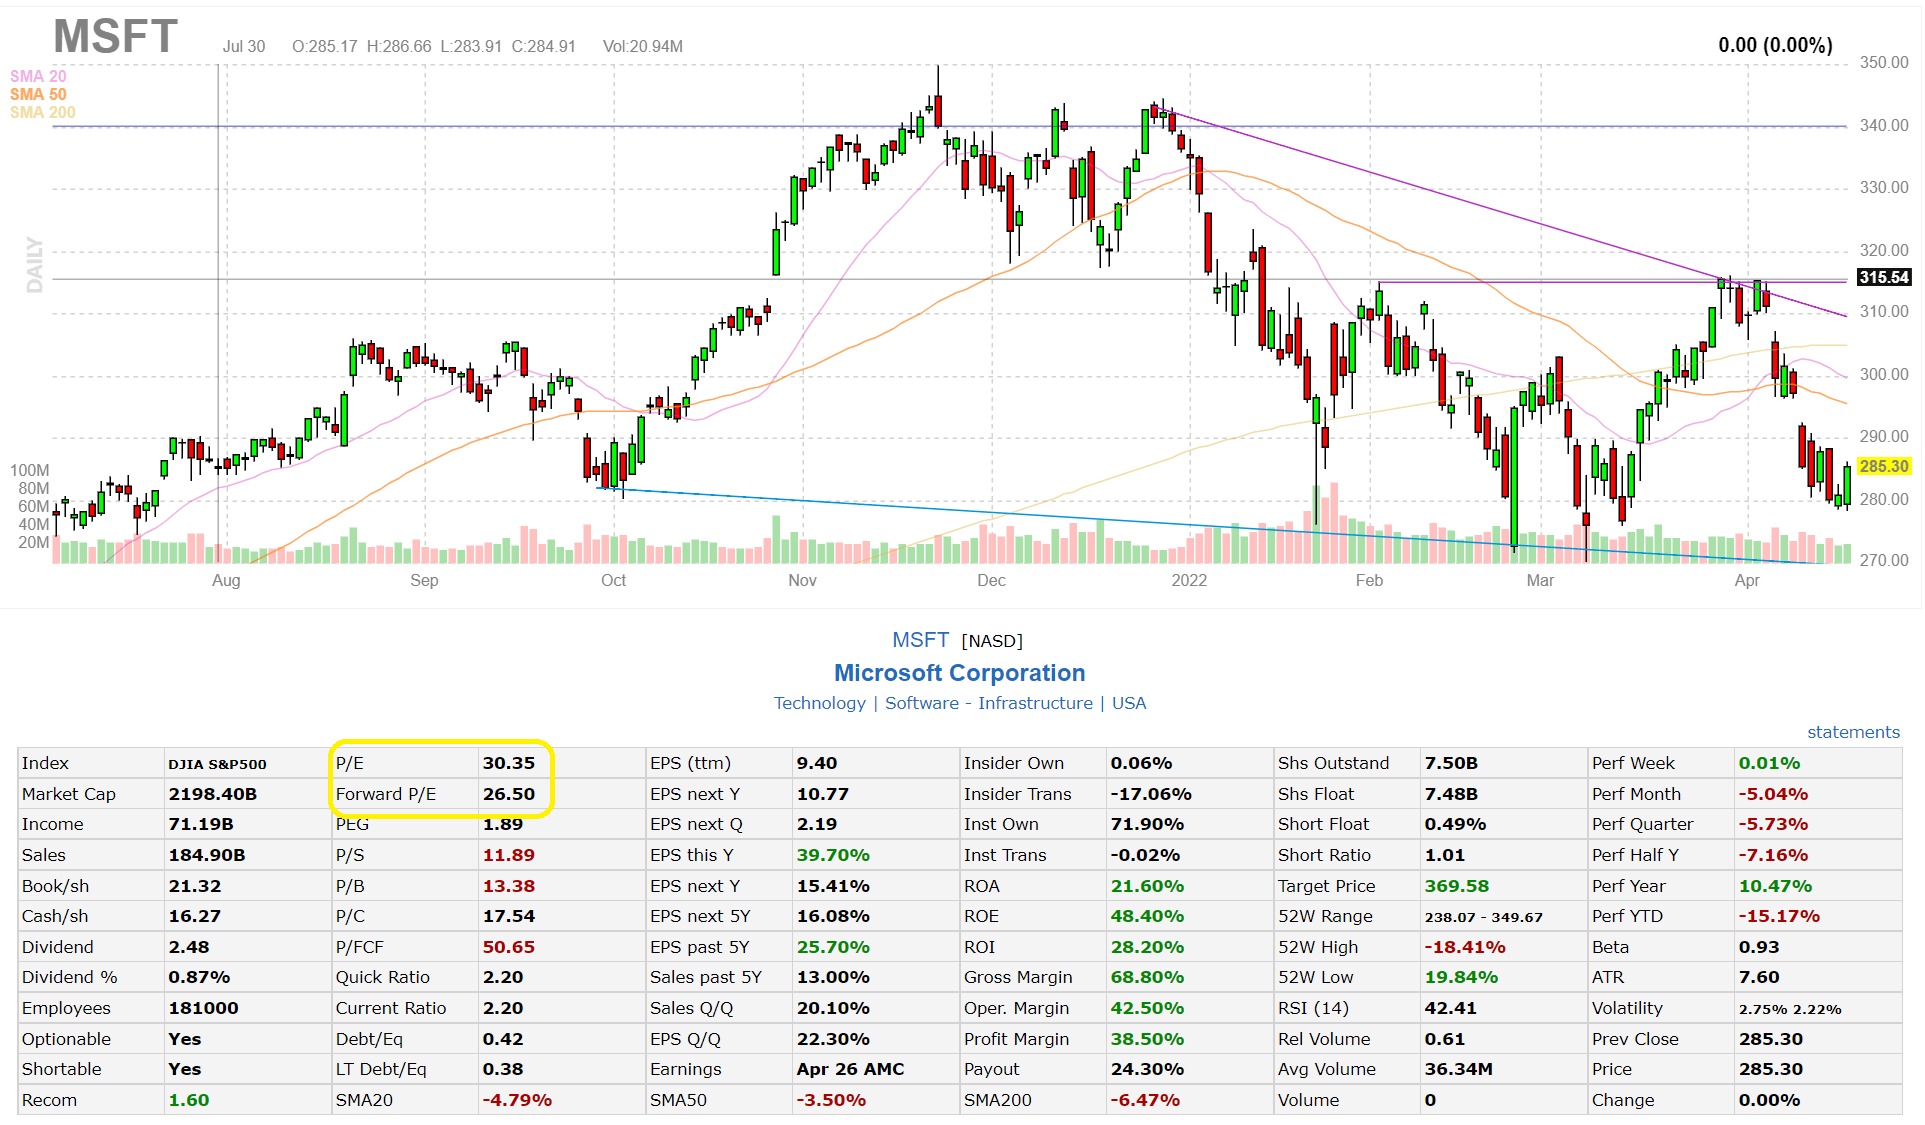
We can see that Microsoft’s current P/E is 30.35, while its Forward P/E is 26.50.
This information tells us that analysts expect Microsoft to have higher earnings in the next 12 months than it had in the previous.
We can know this because we know that the “Price” part of Price to Earnings does not change whether we are looking at trailing or forward P/E. That means that only the “Earnings” part is different, just trailing vs future earnings.
Since Price to Earnings equals Price divided by Earnings, we know that increases to Earnings cause the Price to Earnings to fall, while decreases to Earnings cause P/E to rise.
The lower Forward P/E compared to trailing P/E tells us that forward earnings are higher than trailing earnings, because the forward P/E is lower than its trailing P/E.
Double checking P/E
We can quickly determine that the P/E ratio displayed on finviz is in fact “trailing P/E” by looking at the company’s trailing Earnings Per Share (EPS) and multiplying this by the stock price.
Looking back at the screenshot (to the right of P/E), Microsoft has a trailing EPS, or EPS (ttm), of $9.40. Microsoft’s most recent stock price was $285.30.
Trailing P/E = Price / Trailing Earnings
Trailing P/E = 285.30/ 9.40
Trailing P/E = 30.35
We can see that this calculation matches exactly with finviz’s P/E, so finviz is, in fact, using Trailing P/E for its P/E figures.
This is important because sometimes a financial website might use Latest Fiscal Year Earnings instead of TTM, or might simply use Forward Earnings when displaying P/E ratio. Investors should double check the P/E ratio of any financial website using the simple Price divided by Earnings formula so they understand at what context to analyze that website’s displayed P/E.
How Do You Find the Forward P/E for the S&P 500?
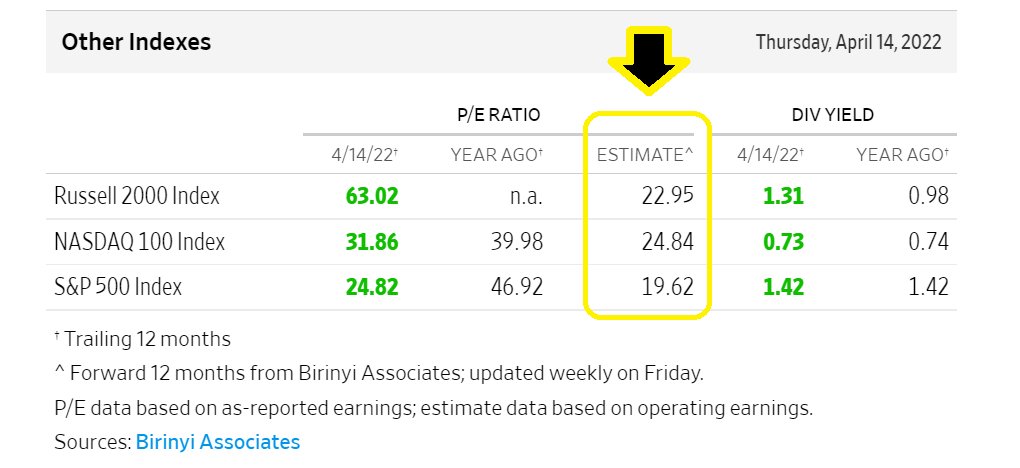
Here’s another great resource that I dug up which can quickly show you the Forward P/E for the S&P 500 at any given time.
The website is provided by WSJ Markets, and will show you the Forward “Estimate” P/E for the Russell 2000, NASDAQ 100, and S&P 500 Index updated weekly on Fridays.
You can see where the P/E ratio for these 3 indexes is displayed on this screenshot; the P/E ratio uses the last 12 months of earnings while the Estimate P/E uses forward 12 months earnings:
You can also see the same data above for the Dow Jones Industrial Average, the Dow Jones Transportation Average, and the Dow Jones Utility Average Index.
Investor Takeaway
I hope you now understand the basics and nuances around Forward Price to Earnings.
If any of it was still not clear, I’d recommend starting at my Price to Earnings Guide to get a full overview of the formula, and then come back to this post to digest the differences with Forward P/E.
Like our buddy Dave Ahern says…
Think of understanding finance like eating a pizza. You wouldn’t eat an entire pizza at once, but rather piece by piece.
In the same vein, you won’t master stock market ratios like P/E and Forward P/E overnight, but will grasp the nuances over time as you read and use these formulas in your investing.
I’d say the next step after learning about P/E’s would be to understand how to analyze a stock, and I’ve got a guide for that here.
There are many valuation ratios you could learn, not to mention the all-important DCF (Discounted Cash Flow) model and qualitative factors to consider. Again, just take it all piece-by-piece. As you learn more, your knowledge compounds, and as your skills improve the compounding potential of your investments increases even more and more.
