Cash is king, and free cash flow acts as the engine’s oil. Determining free cash flow and its different uses remains a fantastic way to find great companies that grow into the future. Free cash flow yield remains an incredibly easy way to find those companies; some say it remains better than the price to earnings, or PE ratio.
Free cash flow yield tells us how well a company can meet its obligations, including dividend payments. If the company struggles to produce enough free cash flow, then growth is almost impossible without dipping into the debt markets to raise funds. And we all know where that road leads.
“We try to stick with companies that are gushing cash flow. We don’t really think of value as low price to book or low price to earnings. We are actually valuing businesses based on cash flows like a private equity investor would. We are valuing businesses based on cash flows.” Joel Greenblatt
As you can see from the above quote, focusing on free cash flow and the metrics associated with them will lead to more profitable companies.
In today’s post, we will learn:
- What Is Free Cash Flow Yield
- Free Cash Flow Yield versus Price to Earnings
- Examples of Different Free Cash Flow Formulas
- Uses of Free Cash Flow Yield
- Free Cash Flow Screeners and Other Resources
Let’s dive in and learn more about the free cash flow yield formula and its uses.
What is Cash Flow Yield
Free Cash Flow Yield as described by Investopedia:
“Free cash flow yield is a financial solvency ratio that compares the free cash flow per share a company is expected to earn against its market value per share. The ratio is calculated by taking the free cash flow per share divided by the current share price. Free cash flow yield is similar in nature to the earnings yield metric, which is usually meant to measure GAAP (generally accepted accounting principles) earnings per share divided by share price.”

As we learn to value companies and decipher the meanings behind the financials, we learn earnings drive free cash flow. And while it remains true from an accounting standpoint, the earnings flow to the cash flow statement.
But in the real world, cash remains king, and cash drives earnings because, without free cash flow supporting the business, it forces them to borrow to grow.
The real number to focus on is free cash flow yield, forget earnings or EBITDA.
Free cash flow offers many benefits, such as:
- Cash from free cash flow is the money a company uses to pay its bills, pursue growth opportunities, and maintain existing assets.
- Allows continued sustainability of dividends, buybacks, and other shareholder enhancements to increase our value.
Any company that can grow and generate free cash flow will grow as the intrinsic value continues to appreciate.
A few final thoughts on the importance of free cash flow and measuring those flows using metrics like free cash flow yield.
Free cash flow remains part of analyzing the health and strength of any business; you must add it if you do not already include it.
Think about this, if a company has negative free cash flow, where does the growth of the company come from, more revenue or debt? If the company lacks the liquidity to grow, it may lack the liquidity to survive.
Of course, companies can borrow more or issue more equity to raise cash, but those are not viable long-term options.
In addition to those concerns, declining free cash flow yields give us a warning sign of trouble that the company’s earnings growth may get on the struggle bus.
Let’s compare free cash flow yield versus the price to earnings.
Free Cash Flow Yield versus Price to Earnings
Cash flow equals the measurement of how much money flows in and out of the company’s checking account; free cash flow remains the measurement of the money left over after the company has paid all its obligations, such as expenses and capital expenditures.

Free cash flow is similar to earnings, except without all the arbitrary offsets on the income statement. As a result, free cash flow remains a better guide to the company’s performance.
The P/E ratio measures how much net income remains available to the common shareholders; however, the free cash flow yield equals a better measure of the performance of our company.
By using the free cash flow compared to the company’s value, we can use that metric as a reliable indicator of the company’s value.
We determine the value by the inverse of each multiple; for value investors, a low PE means that a company appears undervalued, and vice-versa a high PE ratio means the company remains expensive compared to its earnings.
A high free cash flow yield equals what we are after; the higher, the better. A low number indicates the company struggles to create cash flow and is likely to grow slower.
Let’s move on to calculating the free cash flow yield.
Different Free Cash Flow Formulas
The most common way to define the free cash flow yield is to use the market cap as the denominator and divide that by the free cash flow.
Free Cash Flow Yield = Free Cash Flow / Market Cap
Market capitalization or market cap is easy to find or calculate; we can find it on every financial website, such as SeekingAlpha or Stratosphere, my favorites.
To calculate market cap, multiply the current share price by the number of outstanding shares, and voila, you have your market cap.
Calculating free cash flow remains a touch more complicated, depending on which route you want to go. We have the free cash flow calculation that most are familiar with, but we have two others available as well:
- Free Cash Flow to the Firm (FCFF)
- Free Cash Flow to Equity (FCFE)
Both of the above are common calculations when doing a deep dive via the discounted cash flow calculations for intrinsic value.
We can use any of the above; my two favorites are the free cash flow and the free cash flow to the firm (FCFF).
Method One: Free Cash Flow
Let’s look at the calculation for free cash flow; the classic definition below:
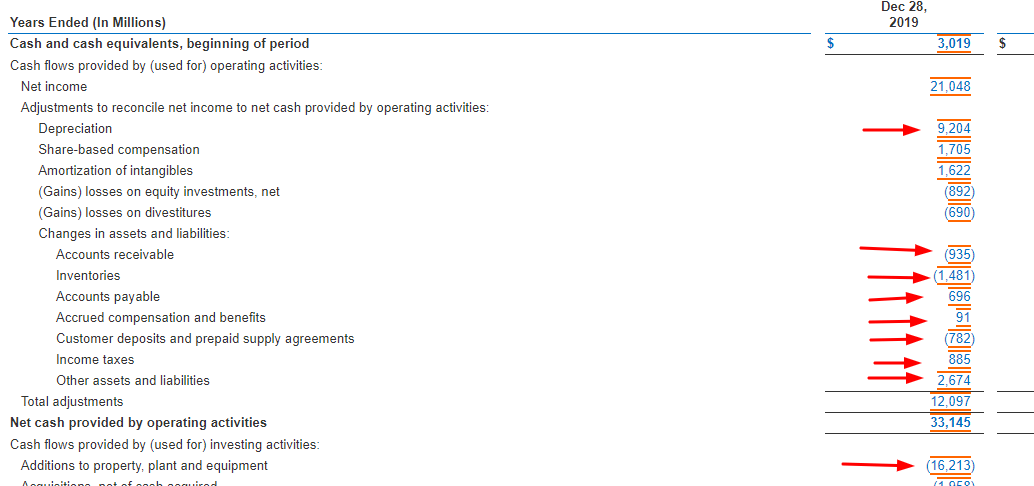
Using Intel (INTC) as our company, for example, today, if we look at the cash flow statement for Intel from its latest annual report, dated December 31, 2020, we can pull our numbers to calculate the ratio.

From the above cash flow statement, we can pull out the following numbers:
- Free Cash flow From Operations – $33,145
- PP&E – $(16,213)
Now, let’s plug those numbers in, and we can calculate our free cash flow.
Free Cash Flow = 33,145 – 16,213
Free Cash Flow = $16,932
Now, to calculate the free cash flow yield, we divide the free cash flow by the company’s market cap.
Free Cash Flow Yield = $16,932 Billion / $215.16 Billion
Free Cash Flow Yield = 7.86%
We could also look at the free cash flow yield in relation to its trailing twelve-month numbers or TTM to get the latest yield.
- Free Cash Flow from Operations – $37,914
- PP&E – $(16,104)
Free Cash Flow = 37914 – 16104
Free Cash Flow = $21,810
Free Cash Flow Yield = $21.810 Billion / $215.16 Billion
Free Cash Flow Yield = 10.13%
Method Two: Free Cash Flow to the Firm
Next, let’s explore the free cash flow yield using the free cash flow to the firm or the unlevered free cash flow. It is referred to as this because it refers to the surplus free cash available to the business if it was debt-free.
We calculate the free cash flow to the firm by starting with the net operating profit, which we can find by taking the earnings before interest and taxes or EBIT and multiplying it by (1-tax rate). From there, we remove all non-cash expenses, changes in working capital, and capex (PP&E). In the formula, it all looks like this:
Let’s set up a chart to calculate our free cash flow to the firm, and I will do it for multiple years so we can calculate a range of free cash flow yields.
We can find the information we need from the income and cash flow statements. I will pull the numbers together for us and use the numbers from the latest 10-k to show you where we gather everything. And then, I will fill in the chart for the latest numbers from previous years, plus the TTM to give us the latest numbers.

Pulling all the numbers from the latest 10-k for Intel, we get the following:
- Net Income – $21,048
- Depreciation & Amortization – $9,204
- Change in Working Capital
- Accounts receivable – $(935)
- Inventories- $(1481)
- Accounts payable – $696
- Accrued compensation and benefits – $91
- Customer deposits – $(782)
- Income taxes – $885
- Other assets – $2,674
- Capex (PP&E) – $16,213
Now, to calculate our change in net working capital, we add all the numbers together and arrive at our number.
Change in net working capital – $1,148
Ok, now I will set up the chart showing the free cash flow to the firm over the last five years, including the TTM. I will plug in the numbers we pulled from the last 10-k so you can follow along at home.
That was fun, and it looks great seeing the growth of cash flows over the years, except for the aberration in 2017. One of the great practices is to do these calculations over five or ten periods; it helps see any trends and gives you a better perspective on the business.
Now that we have calculated our cash flows to the firm let’s find our free cash flow yield for the last five years. Remember that the formula is:
Free Cash Flow Yield = Free Cash to the Firm / Market Cap
- 2016 – 4.68%
- 2017 – 0.40%
- 2018 – 4.89%
- 2019 – 5.15%
- TTM – 8.31%
Another way to calculate the free cash flow yield is to divide the free cash flow, from either calculation, by the shares outstanding to get a free cash flow per share value and then divide that by the current price or historical price. Either calculation will get you to the same place, and if you like to work in per-share numbers, that works just as well.
For example, for the TTM, the free cash flow per share is $5.04, then we would divide that by the current market price of $50.59, and then our free cash flow yield would equal 9.96.
Now that we know how to find our free cash flow yield and several different ways to calculate the free cash flow, let’s dive in and find out what the ratio tells us.
Uses of Free Cash Flow Yield
As with any ratio, the yields are great in and of themselves, but they tell a better picture when we compare them to others in their sector or industry to get a better idea of how your company stacks up and the performance of your company.
Let’s compare Intel’s free cash flow yield to others in its sector. We will use the latest TTM numbers and base them on the free cash flow for easy calculations.
- AMD (AMD) – 0.36%
- NVIDIA (NVDA) – 1.75%
- Qualcomm (QCOM) – 6.62%
- Cisco (CSCO) – 7.47%
- Intel (INTC) – 10.13
At first blush, it appears that Intel is doing a better job creating more cash flow than its competitors. If you were analyzing these companies, the next step would be to look at longer snapshots to get a better idea of the long-term performance.
Let’s look at other popular companies in the market to understand their free cash flow yields.
- Facebook (FB) – 3.49%
- Apple (AAPL) – 3.91%
- Netflix (NFLX) – (0.48)%
- Amazon (AMZN) – 1.27%
- Google (GOOG) – 2.68%
- Tesla (TSLA) – 0.32%
- Exxon (XOM) – 1.32%
- Johnson & Johnson – 4.98%
- Berkshire Hathaway – 4.82%
- United Airlines (UA) – (22.41)%
As you can see, just because the company has a large market cap or is popular in the market is not a recipe for high cash flow yields, as evidenced by Netflix, Tesla, and United Airlines, which all carry negative free cash flows, which tells us to grow those companies either need to take on more debt, or to dilute its shares to raise cash.
Free Cash Flow Yield Screeners and other resources
Here are a few to check out if you are looking for additional resources regarding the free cash flow yield.
For financial websites:
For information across sectors for free cash flow yield, give a reference point for your particular company.
If you want more info on free cash flow to the firm, check this out:
Final Thoughts
Free cash flow yield is an easy, simple metric to calculate, and it can help us separate the wheat from the chaff by separating the companies that can consistently create free cash flow.
Companies that can consistently generate free cash have more opportunities to grow and reinvest in the company and give back to the shareholders, either in dividends or buybacks.
There are multiple ways to calculate free cash flow, and the matter in which you calculate it is unimportant, only that you are consistent with your formulations and stay true to your ideas. Mixing and matching free cash flows could lead to investing in companies that are not truly growing those free cash flows.
That is going to wrap up our discussion for today.
As always, thank you for taking the time to read this post, and I hope you find something of value on your investing journey.
If I can further assist, please don’t hesitate to reach out.
Until next time, be safe out there and take care,
Dave
