Updated 10/12/2023
Did you get tired reading that title? If so, I’m sorry – but I wanted you to know that this entire article is showing you how Global Equities Momentum (GEM) has absolutely dominated the S&P 500 over a 40-year period.
I’ve been reading the book Dual Momentum Investing by Gary Antonacci. I’m finally at the chapter where things come to fruition and you get a tangible plan of action of how to put this plan to work!
And I want to share it with you in this post.
Table of Contents
- The Optimum Momentum Period
- Return Potential from Global Equities Momentum
- How to Execute the Strategy
Essentially, GEM all boils down to this, which I want to quote directly from the book:
“We will anchor our investment portfolio in U.S. stocks and switch into non-U.S. stocks in accordance with relative strength momentum. We will hold bonds (short to intermediate term) only when the U.S. and non-U.S. equity markets are not in an uptrend, as determined by absolute momentum.”
If you’re wondering what relative and absolute momentum are, please go back and read this article. They are IMPERATIVE to understanding how this all works.
The Optimum Momentum Period
As I have mentioned previously, Antonacci determined that a 12-month look-back period is the most effective when determining momentum. He evaluated 1-48 months, and this 12-month period will generate the best results that keep you from overreacting to any knee jerk reactions in the market but also keep you from waiting to long to move your asset allocation.
To use relative momentum, you have to have at least two different assets to compare, such as the stock you’re comparing and then the benchmark. Antonacci is choosing to use the MSCI All Country World Index to essentially replicate the entire market of the world as the benchmark, and then the S&P 500.
Antonacci used a 40-year track record from 1974 – 2013 for his test data. The book was published in 2015, which means that he was likely doing research and writing in 2014, so the timeline matches perfectly.
I wanted to make sure that the data matched about when it was published so he wasn’t picking and choosing to make things fit his narrative – just another bit of making sure that I’m evaluating everything!
Below is a flow chart that shows exactly how to use GEM in your own investing approach using the ACWI Index, an S&P 500 Index, and aggregate bonds.

To explain a little bit more in depth, this is how you would actually do this:
1 – The first thing that you do is you will compare the S&P 500 vs. the ACWI index over the past 12 months to see which has performed better.
I go to yahoo finance to look at an S&P 500 ETF such as SPY and the MSCI ETF, as shown below:
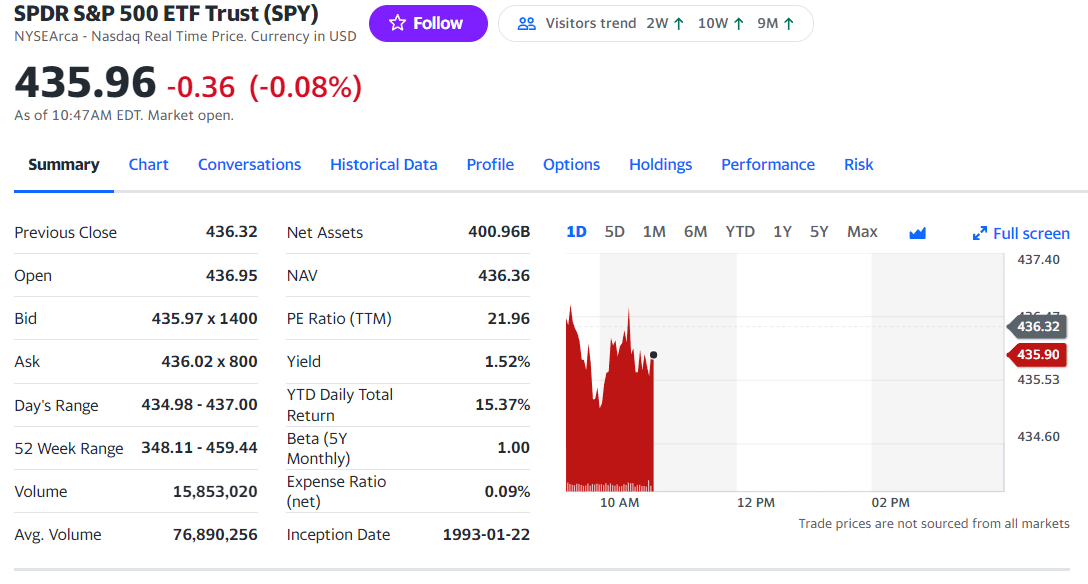
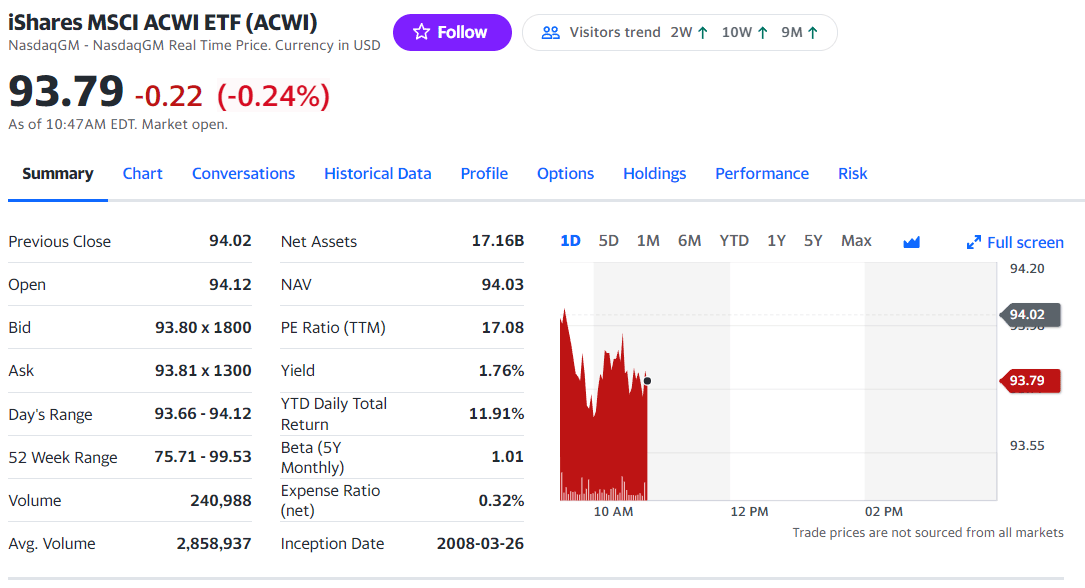
I will then click on the Performance tab and I can quickly see the performance of both of these ETFs over the past year without needing to do any sort of math:
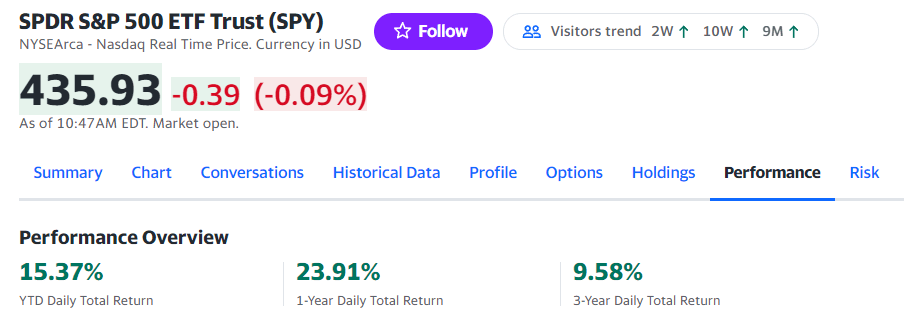
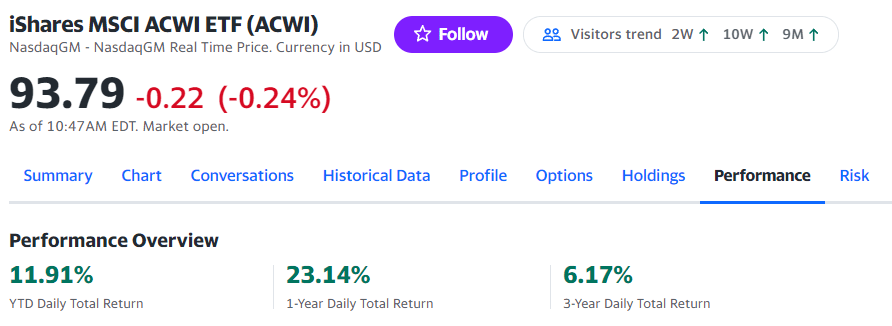
As you can see in the screenshots above, SPY and the ACWI index have been about flat over the last 1-year period, though ACWI has been lagging the SPY YTD.
2 – Next you will then compare that to the T-Bill rate over the past year.
I like to check this at bankrate.com because I can easily see what it was a year ago vs. today and see the trend, shown below:
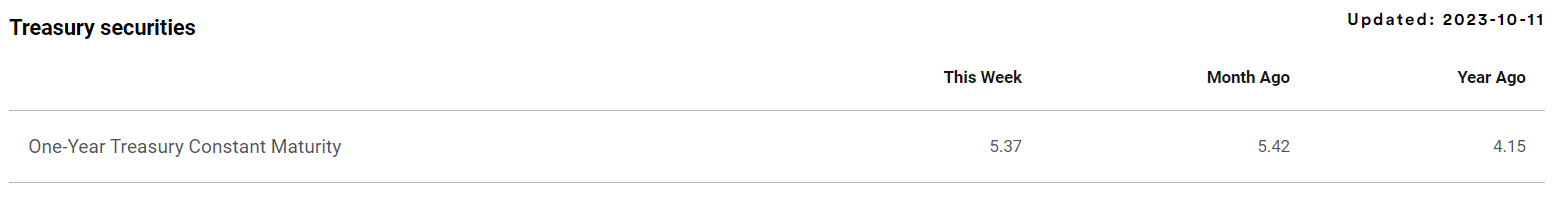
So, the 23.91% performance of SPY is way above the current T-Bill of 5.37%, so off to the next we go!
3 – Buy and hold the S&P 500 ETF of SPY until the next month when it’s time to evaluate again next month
Doesn’t this seem outrageously easy? It sure does to me.
Almost too easy, honestly…
I’m always skeptical of anything like this that seems to easy to be true, ya know?
So, the immediate next question is, “what sort of returns can I expect with this sort of methodology in my portfolio?”
Return Potential from Global Equities Momentum
Earlier in the chapter, it was noted that the S&P 500 Compound Annual Growth Rate (CAGR) was 12.34% for this 43-year period. Using Global Equities Momentum, your CAGR was 17.43%! So, it was more than 5% better each year!
Sounds like an insane amount to me because I am ALWAYS looking at numbers in a compound interest calculator, so I have a general idea of how much this can really impact your returns. I know that not everybody does this (actually, most people don’t) so let me help break this down a bit for you:
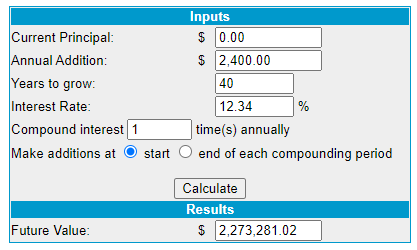
If you put in $200/month for 40 years, and you earned that same 12.34% that the S&P 500 returned (which is extremely good, I might add), you would have nearly $2.3 million in 40 years!
Want to take a guess how things would look if you invested this same $200/month but instead were using the GEM strategy and had returns of 17.43%? Let me just show you…
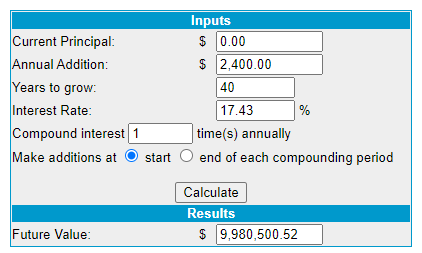
Nearly $10 Million! That is absolutely BONKERS!
That is the value that 5% can have on your portfolio. So yes, I’m not going to lie; I am extremely intrigued about using GEM in my own portfolio, but first I want to learn even a little bit more about it.
The thing that I love about Dual Momentum Investing is that Antonacci really doesn’t put a ton of fluff into the chapters. You get great information in a super easy-to-understand fashion and then he follows it up with a ton of charts to continue to drive the point home.
I understand that using GEM can get me some insane returns, but I want to understand it even deeper…like, why does this simple process work so well? In these next few charts, the point is really driven home, and hopefully, it makes as much sense to you as it does to me. Just take a look at these three charts and then really think about what they’re saying:
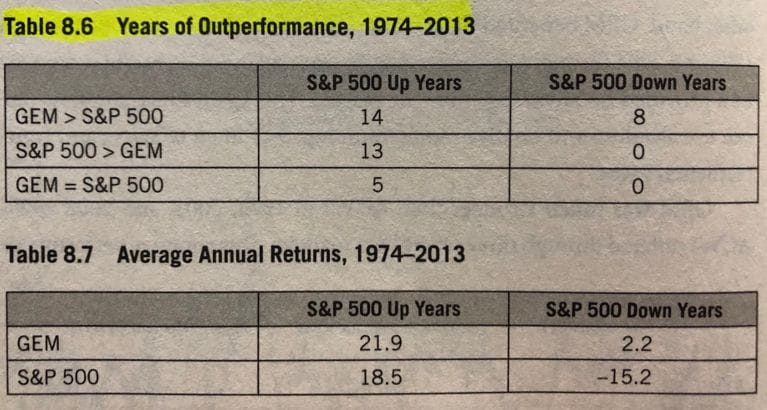
To me, this was screaming that GEM is essentially a hedge against down years in a way. When the S&P 500 is going up, as it normally does, GEM still outperforms the S&P 500 but by a much smaller margin and on a pure numerical basis for the amount of times of outperformance, it’s essentially equal.
But, when the S&P is going down, as it has done many times before, GEM is 8-0 in its outperformance and averages a 2.2% CAGR while the S&P 500 is -15.2%.
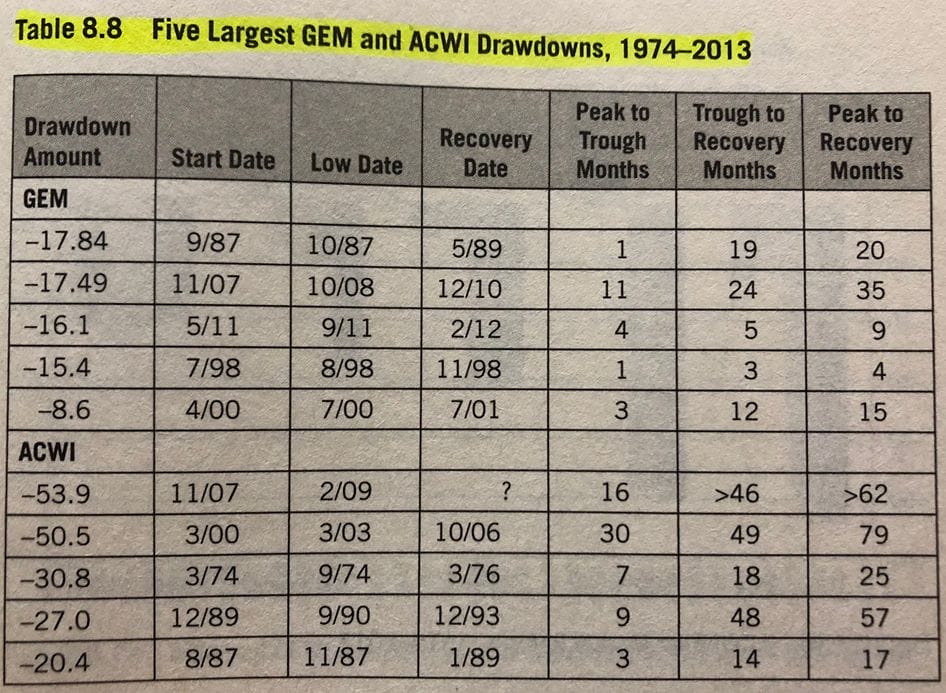
On top of that, when you compare GEM vs. ACWI, you can see that the worst years for GEM are not even in the same ballpark as the worst years of performance for ACWI. The worst year in 40 years with GEM is -17.84% while that wouldn’t even crack the top 5 for worst years with ACWI.
So, basically, GEM is a minimal outperformer of the S&P 500/ACWI in up years and is an absolute dominator in down years!
In a nutshell, GEM is simply protecting you from lower lows while ensuring not to hinder you from making all-time highs.
Now that’s investing with a margin of safety, emphasis on the safety…sound familiar?
How to Execute the Strategy
But how does this really even work? Well, this is where the importance of absolute momentum comes back into play, and if you haven’t read my previous post, then you need to go read it now because it’s the foundation of all of this.
Essentially, by utilizing absolute momentum when you compare the return vs. the T-bill, you can switch into bonds when need be to protect you from a potential crash in the market.
Of course, the market can be extremely volatile even from day to day, so this is why Antonacci uses a 12-month lookback period. He has determined that by using 12 months, you essentially will ignore the short blips like we saw with the pandemic but you can make the move into a safer investment if it seems like a sustained downturn.
If you were using a 3-month lookback period, you would’ve flipped into bonds right in late February 2020, meaning that while you might’ve missed a lot of the downside and sold around $296, you would’ve also missed out on a ton of the upside.
You would’ve essentially bought back in during early June 2020 around $320, meaning you missed out on $24/share, or 7.3% of the current ETF price of $326.
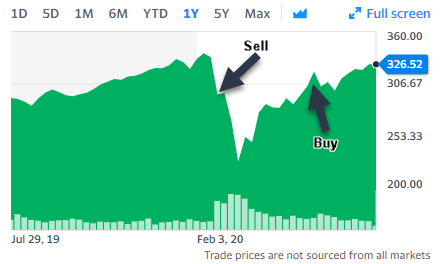
Obviously, this is not ideal, and this is why a 12-month lookback period is perfect for any sort of analysis that you’re doing when using GEM!
Antonacci acknowledges that this process is not overwhelmingly hard and says that it’s really the point of it. He uses an Albert Einstein quote saying, “Everything should be kept as simple as possible, but no simpler.”
I think that this process is pretty dang simple to follow and should be something that we all consider implementing in our portfolio. All it takes is a little bit of dedication to look into the numbers and make sure that you’re analyzing everything properly, but as I’ve shown, a few googles can get you to the right place!
Antonacci recommends that we really try to use ETFs that have the lowest expense ratios possible because those can ruin returns if you’re not being careful, but that’s something that we all knew, right?
He recommends using trading software such as PerfCharts by StockCharts.com. Unfortunately, I have not used this software before, but I might check it out just to see what it looks like.
Investor Takeaway
If you feel like GEM might be a little too close to “trading” then I completely understand where you’re coming from. And it really is timing the market, which we all have been told is something that you should really not do.
Personally, I am one that’s always willing to take a risk and am looking for my own investing identity, per se. I’ve been investing for a few years now and have tried a lot of different things.
While value-investing makes a ton of sense to me and it’s what got me started, part of me wonders if it’s still applicable. I do laugh because I oftentimes here people say that right when you really, really start doubting value-investing, that’s when it shows that it’s the best way to invest, which would be right about…now.
I mean, when Dave Portnoy is saying that he’s a better investor than Warren Buffett…has anything ever been more of a sign than that? I don’t think so.
But I’m going to keep challenging myself. I am going to keep learning about new styles, new methods, other great investors and their strategies, and just continue to push myself to define my own philosophy, and I urge you to do the same!
The reason that I go on this “rant” at the end is because I want you to know that I understand if you feel like this is too dangerous because you are timing the market in a sense. I get it. You just need to find your own investing identity and stick to it.
If you’re not someone that can stick to this plan, knowing that in the good S&P 500 years you might see underperformance, then you shouldn’t even start in the first place.
There’s a million ways to outperform the market and a million philosophies to have. I am going to adapt Global Equities Momentum as a small portion of my portfolio to see how it goes. If that works for you, then feel free to join; if it doesn’t, then keep going your own way!
We’re all on a path to financial independence and guess what, there’s more than road to get there!
