Google finance is a great tool to use in your investing arsenal. It’s a great way to get updated ticker information, as well as news, financials, and other key metrics.
You can quickly see past price performance (with this special trick), as well as 1D, 5D, 1M, 3M, 6M, YTD, 1Y, 5Y, and MAX.
To see the performance of any stock between two dates: click and hold on the starting point on the chart, and drag along the price chart to see the price difference, updating in real-time.
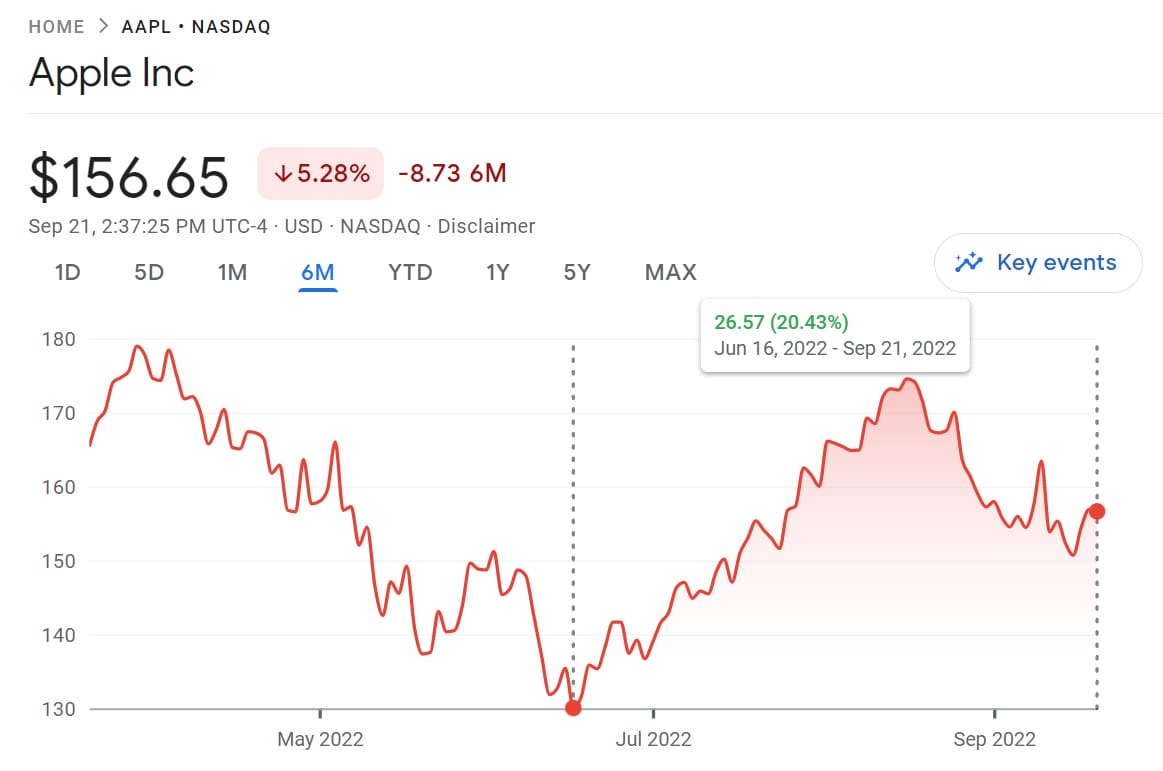
In this case, I clicked on Jun 16, 2022, and held down the button until I scrolled all the way to Sep 21, 2022. Apple gained +20.43% in the period.
On the upper right hand of the Google Finance website, you see the following metrics:
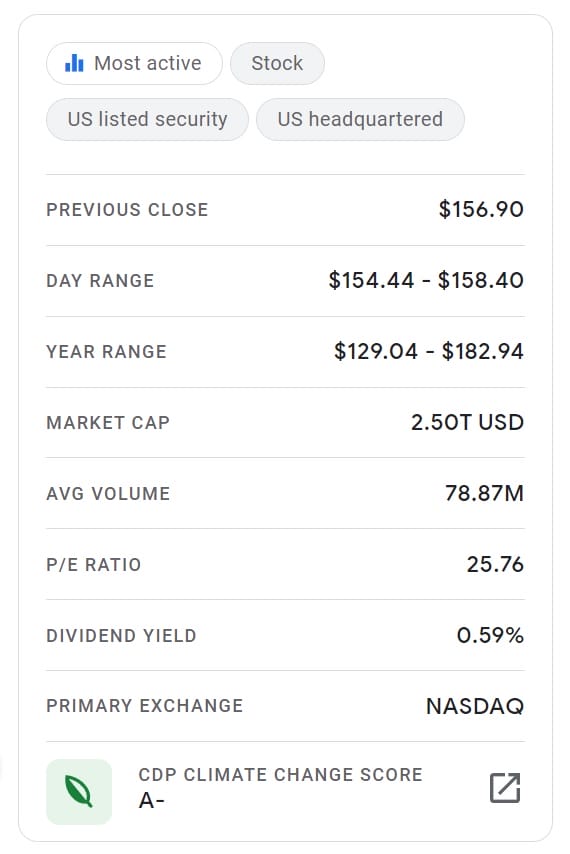
Here’s a description of what each key metric means.
How to Read Google Finance’s Key Metrics
The first number is the stock price at the previous close. This tells you the last price the stock traded at in the last market session.
| PREVIOUS CLOSE: | $156.90 |
Keep in mind that this will usually be different than a stock’s “open price” because there is a stock market after hours, and pre-market period of trading (only for certain approved traders).
| DAY RANGE: | $154.44 – $158.40 |
The day range tells you the high and low that the stock has moved for the day.
| YEAR RANGE: | $129.04 – $182.94 |
This is the high and low that the stock has moved for the past 52 weeks. These numbers can give you a good sense of the general volatility of the stock for the past year.
| MARKET CAP: | 2.50T USD |
Market cap is the market capitalization of the stock at the time of look up. Remember that market capitalization is the number of shares times the share price. This gives you a picture of the real size of a company in the market, not the share price itself.
A company with a lower stock price might actually be bigger than one with a higher stock price if it has more shares outstanding and thus a higher market capitalization.
| AVG VOLUME: | 78.87M |
Volume is the number of shares that were bought or sold during the day. When a stock has moved a high percentage either up or down, this is usually accompanied with a high value.
Avg. refers to the average volume this particular stock has seen in the past 30 days. You can compare these two numbers to determine if the volume is particularly high or low for the day.
| P/E RATIO: | 25.76 |
P/E is the Price to Earnings of the stock. This takes the market capitalization, or the price, and divides it by the company’s total earnings. A lower P/E is generally favored because it indicates that the stock is cheaper relative to its earning power. P/E is one of the major valuation metrics normally used in a value oriented stock analysis.
Note that you can also calculate this ratio by dividing the share price by the earnings per share. This way just takes out the shares outstanding from both sides of the equation.
| DIVIDEND YIELD: | 0.59% |
A dividend is paid from the company to investors who own shares in each stock. Dividend yield calculates the dividend payment against the share price and tells you what percentage return this dividend will be on your investment capital.
| PRIMARY EXCHANGE: | NASDAQ |
Where a company’s shares trade. The two most common are the NYSE and NASDAQ.
| CDP CLIMATE CHANGE SCORE: | A- |
A metric provided by CDP Worldwide, a not-for-profit charity which tries to evaluate a company’s environmental impact from those who respond to CDP.
Google Finance Financials Table Explained
If you scroll down the page on Google Finance, you will see a table that looks like this:
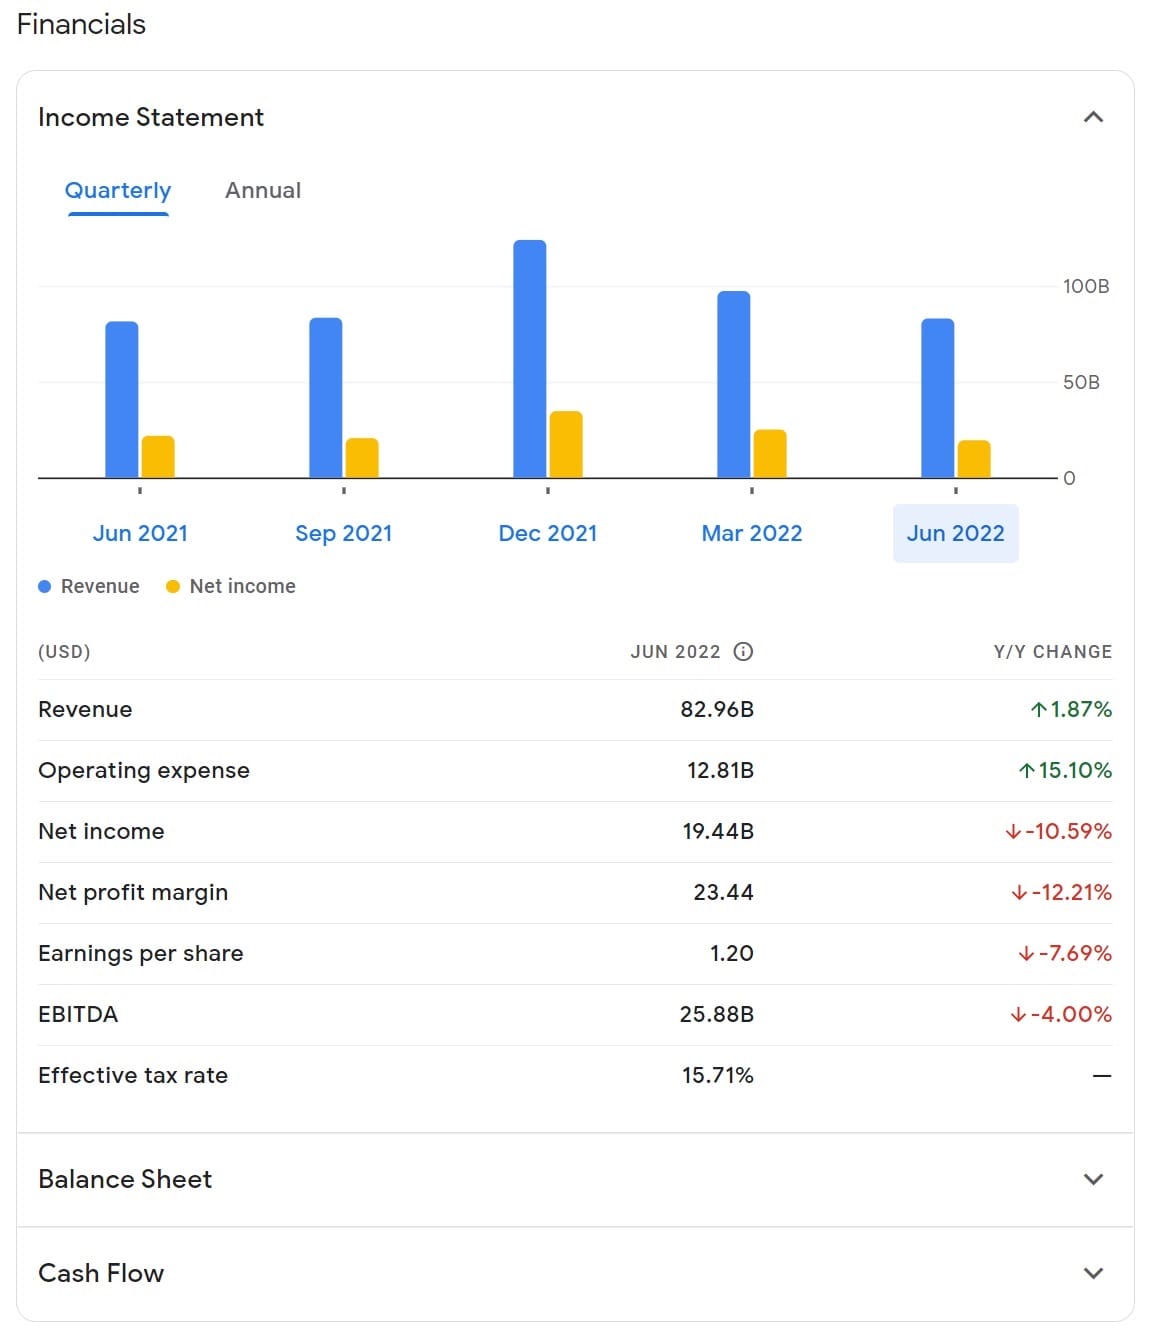
You can switch between Quarterly and Annual numbers on the upper left of the table. You can see for this example, quarterly financials are being presented for Apple’s JUN 2022 quarter.
On the right side is Y/Y CHANGE, which is a great way to see how much the company has improved on a metric in the last 12 months. Use this as a starting point to understanding the company. You’ll want to also look at long term trends to get a better picture if you want to invest in the stock.
| Revenue: | 82.96B |
Revenue is the number of sales a company brings in, before taking out expenses. In general, investors want to see this number increasing over time
| Operating expense: | 12.81B |
There are two major types of expenses on company income statements:
- Cost of Goods Sold
- Operating Expense
These are the critical building blocks for every public company’s “P&L.” P&L is simply Profit & Loss, or another way to say Income Statement.
Subtracting Cost of Goods Sold and Operating Expense will leave you with Operating Income, which is a primary way that analysts compare the business models of different companies.
| Net income: | 19.44B |
Net income is a company’s profit for the year. It is calculated by taking Revenue and subtracting all expenses, which includes Cost of Goods Sold, Operating Expense, and Taxes and Interest.
| Net profit margin: | 23.44 |
Margins help investors understand how profitable a company is.
Net profit margin is calculated by dividing Net Income by Revenue. Apple’s Net profit margin of 23.44 tells us that they convert 23.44% of their revenue into profit.
| Earnings per share: | 1.20 |
Earnings per share is one of the most popular metrics on Wall Street. It simply takes a company’s Net Income and divides it by Shares Outstanding.
It tells an investor how much earning power they receive per each share they purchase of a stock.
| EBITDA: | 25.88B |
EBITDA stands for Earnings Before Interest, Tax, Depreciation and Amortization. It is more of an advanced metric; learn more about EBITDA with this educational article.
| Effective tax rate: | 15.71% |
This metric is exactly how it sounds. It tells investors what percent of profits the company paid taxes on in the quarter (% of Pre-tax Income, another Income Statement metric).
Investor Takeaway
Google Finance has many great features and is a fantastic place to start your research on a company.
Their website includes tabs for Balance Sheet and Cash Flow, which you can click on to get a drop-down box of more important financial metrics.
We’ve covered those financial statements with in-depth articles on the Balance Sheet and Cash Flow Statement, so be sure to check those out if you continue with the other features.
Google Finance also has a great “Discover more” tab, where you can find a company’s competitors, peers, suppliers, customers, and more.

Andrew Sather
Andrew has always believed that average investors have so much potential to build wealth, through the power of patience, a long-term mindset, and compound interest.
