As a type of Dividend Discount Model (DDM), the H-Model is a valuation tool that has its core methodology based on discounted cash flows, which are approximated here with dividends. The end result is a Net Present Value (NPV) calculation of the future dividends of the company.
The H-Model is a popular variation of the classic Gordon Growth Model (GGM) that allows for short-term growth rates in the dividend to be factored in on top of the regular terminal value as calculated with the GGM and its assumed growth rate in perpetuity.
Unlike a two-stage DDM which instantly changes growth rates, the H-Model DDM allows for a more realistic gradual transition from the short-term growth rate to the long-term sustainable growth rate.

This lesson will discuss the reasons for using the H-Model as well as the calculation and inputs used in the formula.
We will then jump into a real-life example using United Postal Service (UPS) who is currently experiencing outsized growth due to the boom in deliveries associated with e-commerce.
The Importance of Short vs. Long-term Growth Rates
While investors should give a company credit for strong growth in the short-term, it is hard to justify using a growth rate above potential GDP growth in the long-term.
The H-Model is a perfect tool for transitioning from a period of high growth in the short-term to a sustainable long-term growth rate.
The reasons for this differentiation between short and long-term growth is that outsized growth being generated from new product or service offerings, first-mover advantages, and even competitive advantage, tend to be transient.
This is because new product or services will eventually become widely adopted and competitors will enter the space to get their piece of the market and will spend more money to improve their competitive positioning.
As such, long-term growth rates should be conservative and my rule-of-thumb is that they should generally not exceed 3% which represents the long-term potential growth rate of GDP.
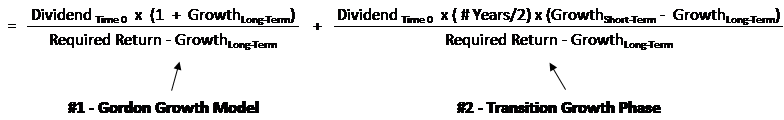
The H-Model Formula
The H-Model formula can be broken down into two parts which are then added together:
#1) The Gordon Growth Model (GGM): This is a single-phase, terminal growth calculation which forms the core base of the H-Model valuation. It takes the previous year’s dividend brought forward by the long-term growth rate and then divides it by the cost of equity capital/investors’ required return minus the long-term growth rate in perpetuity.
#2) The Transitory Growth Phase: This adds the excess growth of the dividend amount which is over and above the long-term rate. It assumes that the short-term growth rate transitions to the longer-term rate by using the half-life of the transition period.
These excess dividends over and above the long-term growth rate are then once again divided by the cost of equity capital/investors’ required return minus the long-term growth rate in perpetuity.
H-Model Example with United Postal Service
UPS has been experiencing outsized growth in the past few years due to the increase in deliveries resulting from the rise of e-commerce.
However, this outsized growth cannot continue into perpetuity and will eventually disappear as the share of e-commerce compared to brick-and-mortar sales stabilizes.
The H-Model is a good approach to use for a company in such a transitory growth phase.
Step 1: Establish the Dividend Amount
In the most recently ended 2018 year, UPS paid dividends of $3.64 per share. Furthermore, and not to be overlooked, UPS has been repurchasing shares over the past 3 years which is another way to return cash to shareholders.
In 2018, UPS repurchased a net $1,566 million worth of shares which, when divided by the average 870 million of shares outstanding during the 2018 year, would represent a further $1.8 per share of cash that was returned to shareholders.
Together, this means the amount of cash being returned to investors through both dividends and share repurchases in 2018 was approximately $5.44 per share.
Step 2: Establish the Growth Rates and Duration of Time
Over the past three years, revenue growth at UPS has averaged 7.2%. Likewise, the dividend has grown from $2.92 per share in 2015 to $3.64 per share in 2018 for an average growth rate of 8.2%.
For the purposes of our calculation, let’s assume that growth will transition from the 7.7% mid-point of these two growth rates to a long-term sustainable growth rate of 3% over the next 10 years.
Step 3: Establish the Cost of Equity Capital or Required Return
For the cost of equity capital, we will use 9% to approximate historic stock market returns over the past 100+ years and which is a good representation of an investors opportunity cost of capital.
Step 4: Plug the Inputs into the H-Formula

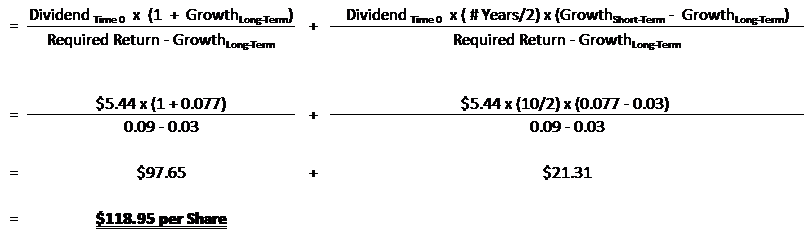
This calculated share price of $118.95 turned out to be a pretty good estimate given the current share price around $115 as of the time of this writing.
That being said, like all valuation models, they are an estimate of the value and lots of subjective inputs here. While we can do a good estimate of calculating cash flows to shareholders, the discount rate, growth rate and and the number of years used used as inputs can have a big impact as well.
The core of the valuation should remain the GGM piece and it is also important to be cognizant of how much growth one is paying for.
In our example, 82% ($97.95/$118.95) of UPS’s value is being derived from the company’s current dividend and long-term GDP average growth potential, while 18% ($21.31/$118.95) of the valuation is due to growth in the near-term.
Final Thoughts on the H-Model and Growth
Growth rate assumptions play a crucial part in any valuation and changes can have a significant impact on the final numbers, especially when dealing with terminal values and its assumed growth into perpetuity.
Above-average growth being generated tends to be transient as the competition steps in and/or the market becomes saturated.
The H-Model is a great approach to add to the valuation of a company that has a short-term growth rate which naturally slows over time towards its long-term potential.
