The NASDAQ, or the National Association of Securities Dealers Automated Quotations, is a market index just like the S&P 500 or the Dow Jones Industrial Average, but it is an index that is different in nature than both of those indices, so it really begs the question – how is the NASDAQ calculated?
While the S&P 500 tracks the 500 largest publicly traded companies by market cap and the Dow tracks 30 of the largest and most influential companies on the market, the NASDAQ Composite tracks every company that is traded on the NASDAQ, which is over 3,300 as of 2020. In essence, they’re giving you a true representation of what the market actually is doing.
By tracking every single company, there is a major benefit that they’re getting the true market representation because every single company is being accounted for, but how is the price actually calculated? Well, it’s simpler than you might think!
Essentially, they’re taking a weighted average of each company based off of the market cap of those companies, multiplying them by the share price of that company, and then using a “divisor” to be able to make the NASDAQ a more realistic number for us to track and utilize.
It’s really no different than how the S&P 500 is calculated and quite frankly, makes the most sense! A company that has a market cap of $100 billion shouldn’t be equally weighted vs a company with a market cap of $50 million, right? That wouldn’t exactly be an accurate portrayal of what the market is doing.
So, all three of these track an index, so it doesn’t really matter what index you should use for your own tracking purposes, right?
Wrong!
While they do all generally perform similarly to one another, there definitely are some large distinctions between the two, and it’s imperative to understand if you’re using an index as a benchmark (which you should be doing!).
In the amazing graph below from Advisor Perspectives, you can clearly see that the three indices all generally have the same shape, but that the actual performance is really not that similar at all!

The Dow performed at 66.1% from it’s 2000 peak while the S&P 500 was at a respectable 53.5% and the NASDAQ was at a measly 35.7%! I want to note here that these are exclusive of dividends, so you could expect even greater returns had you invested in either index during this timeframe.
So, why does any of this matter? Well, it’s simple really!
A lot of times when people are talking about the stock market, they’re going to talk in very general terms about how the “market” is doing. When they do this, they’re referring to an index, regardless of what index that might be.
I think there are major pros and cons of all of them, with my personal preference being the S&P 500 because it has the most legit calculation, which is also the same as the NASDAQ, but it only takes into account the 500 highest market cap companies, which is primarily what I am going to want to invest in unless I’m getting extra risky! And by risky, I likely mean stupid…lol.
So, while that’s great and all, you might be asking “why does this matter to me?” Well, that answer is also simple.
I oftentimes will quote something along the lines of “the stock market average since 1980 is 10%” when referring to the CAGR, or Compound Annual Growth Rate. I quote this to show people the returns that they could’ve achieved by simply investing in the stock market as a whole and not picking any individual stocks.
When I quote this, I am referring to the S&P 500, but maybe you think that the NASDAQ is a more accurate representation of the market!
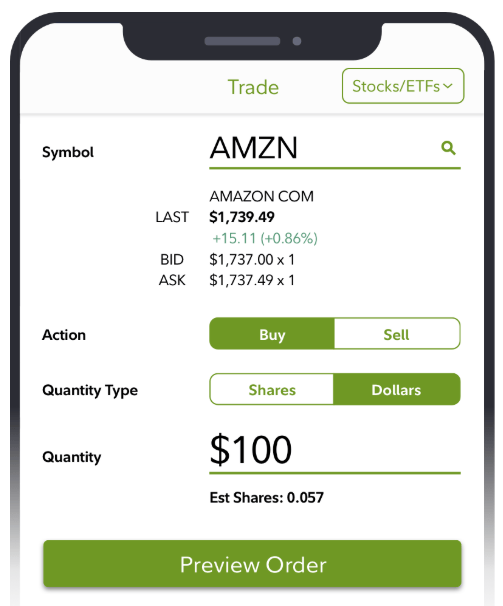
If so, that’s great! You can invest in the NASDAQ very simply by buying into the ticker ONEQ, which is the Fidelity NASDAQ Composite Index Track. The current price of this, as of 3/20/20, is $268.13. So, you could buy into an ETF that will essentially replicate the results of the NASDAQ Composite index for that price, or, if you have Fidelity, you can buy partial shares as long as you do it on your phone:
The reason that I’m really getting this far into the weeds is because before you invest in anything, you need to understand exactly what you’re investing in, even if it’s an ETF that’s meant to track the market or if it’s actually an individual stock.
Just as it’s imperative to do your analysis on any stock that you’re thinking about buying, and a great starting point for that is with the Value Trap Indicator, if you’re going to invest in an ETF to track the market, you need to understand how that ETF is being calculated.
I talked here today about how the NASDAQ is calculated similarly to the S&P 500 but includes over 6 times the amount of companies and how it’s very, very different than the Dow, but that doesn’t mean that it’s better or worse – it means that you should think about what makes the most sense in your eyes and then invest in that ETF.
This is something that’s very important to me because I personally know people that put their money into “the market” but they have no idea what they’re actually investing in. As I showed in the graph above, the returns can vary drastically depending on what index you might be throwing your money into, so it really is imperative to understand the math and the analysis behind the investment choice that you’re making.
Is it hard? Absolutely not. A simple google search can help show you so much. It can show you so much that it honestly can be overwhelming if you’re a brand-new investor. If you are, start small in a way that you’re already accessing information – I’m thinking with Instagram, YouTube or following a new investing blog.
Andrew and Dave are notorious for saying that you need to “invest with a margin of safety…emphasis on the safety,” and there is no better way to do that than to dabble a bit into a total-market index fund like ONEQ – but you better understand what you’re actually investing in!
