An investor’s Information Ratio is a measure of the Active Return that is being achieved per unit of Active Risk. The Information Ratio is important to investors because it is one of the best indicators of the skill level of the portfolio manager or individual retail investor.
This article will discuss the calculations of the Information Ratio as well as its interpretations and implications for institutional and retail investors.

How to Calculate the Information Ratio
The Information Ratio can be calculated by dividing the portfolio’s Active Return by its Active Risk. Active Return is the amount that the portfolio return is above that of the benchmark.
Active Risk (also commonly referred to as Tracking Error) is the standard deviation of Active Return which means it is a measurement of the volatility of portfolio returns around the benchmark return.

Side Note: While similar in appearance to the more commonly taught Sharpe Ratio, the Information Ratio differs in two key aspects.
First, in the numerator the Information Ratio is subtracting the benchmark return from the portfolio return rather than risk-free rate as in the Sharpe Ratio. This leads to the numerator for the Information Ratio being Active Return rather than the Excess Return over the risk-free rate.
Secondly, the denominator is now the standard deviation of this new Active Return metric, referred to as Active Risk.
To get more familiar with the calculations of the Information Ratio and to add in some numbers which we can interpret later, let’s look at the returns of three hypothetical managers.
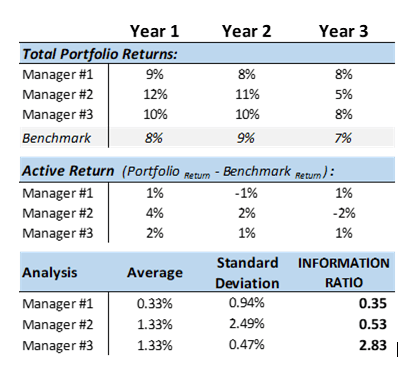
Side Note: The average Active Return and its standard deviation have been calculated in Excel using the software’s formulas but CFA candidates would need to be prepared to do these calculations manually by hand/calculator.
As can be seen by the Information Ratios in the example, while managers #2 and #3 have identical average Active Returns of 1.33%, they achieved those returns by taking on very different levels of risk as witnessed by the standard deviations of the active return of 2.49% and 0.47% respectively.
This leads to very different Information Ratios with manager #3 having the most desirable Information Ratio at the highest 2.83.
Interpretation of the Information Ratio
The Information Ratio measures the regularity and dependability in a manager’s ability to generate active return.
The higher the information ratio, the better, as it indicates that more active return is being generated per amount of risk (as measured by volatility). A negative Information Ratio is obviously bad as it indicates that the portfolio’s return is less than the benchmark return and thus Active Return is negative.
Naturally, a rational investor should be willing to pay a manager a higher fee for achieving higher Active Returns, but, they should also take into account if the manager is achieving those active returns in a consistent way that does not bring a disproportionate amount of risk.
As witnessed in the example above, while two managers or investors might both have the same average Active Return over a multi-year period, the volatility of those returns around the mean could be drastically different and this would entail completely different risk levels.
The Information Ratio is a great way to compare manager’s skill levels and determine whether the management fees they are charging to invest with them are appropriate given the risks and compared to the competition.
A “closet” index fund will have the same Sharpe ratio as the benchmark and a very low information ratio. This is because the “closet” index manager is not outperforming the benchmark but merely copying it.
By mimicking the index, the manager’s Active Return would be close to zero and likewise, their Active Risk would be next to nothing as well. In our example, manager #1 could be considered to be a “closet” indexer.
This is not necessarily a bad thing as a passive index approach can be desirable for many investors.
However, the fees being charged for such a passive fund should be minimal as no skill is being added. The embrace of low-cost Exchange Traded Funds (EFTs) over the past couple decades goes to show this critical thinking by the broader population as intelligent investors have begun to shun higher cost mutual funds who are really just “closet” indexers and are not adding the skill level that their high management fees suggest.
Limitations of the Information Ratio
The main limitations of the Information Ratio are first and foremost that it is backwards looking and as many investment product disclaimers state in their fine print “past performance is not indicative of future performance”.
The second main limitation of the Information Ratio (same among other risk return ratios), in my opinion, is that it uses volatility as a measure of risk.
As many Warren Buffet fans are aware, volatility is not necessarily risk, and the long-term value investor is more worried about errors and omissions in the analysis of their individual investments. If one has a long enough time horizon, it is the end result that truly matters and not how bumpy/volatile the path was to get there.
Practical Uses for the Investor
For institutional and retail investor alike, the Information Ratio is simple to calculate once one has properly calculated their portfolio return on an ongoing basis and picked an appropriate benchmark.
Tracking your Information Ratio on an ongoing basis is a great habit to get into as it allows one to honestly assess their investment skill level and consistency while also helping to spot unintended changes in the results of one’s investment approach. If one wishes to tone down the Active Risk in their portfolio, they can allocate more of their portfolio into low-cost passive ETFs that align with their benchmark.
The information ratio is also a great tool to employ to help make your decision on a third party investment fund or an advisor.
While the third party itself might not provide you with their fund or advisory service’s Information Ratio, they will most likely (and are legally obligated to do so in some countries) provide you with historical performance of the fund or a composite of historical returns for the advisory firm’s clients with the same risk tolerance and objectives.
Using this information and an appropriate benchmark, investors can do their homework and compare the options available to them. Always be sure you are comparing apples-to-apples and using portfolio returns net of fees!
