In the insurance industry, “other people’s money” is known as float. In a shareholder letter, Warren Buffett once said that float “had cost us nothing and made us money. Therein lies an accounting irony: Though float shows up on our balance sheet as a liability, it has had a value to Berkshire greater than an equal amount of net worth would have had.” Translation: Float is good.
As mentioned more than once in Warren Buffett’s shareholder letters, insurance float is the bread and butter of his wealth. He has used these monies to create his vast empire and allow him to invest in or buy outright great companies like Geico, American Express, Coca-Cola, Wells Fargo, and recently, Apple.
What exactly is insurance float, how do we find such a thing, and what does it mean to us as investors? And why does Warren Buffett like it so much?
In today’s post, we will discuss that and much more.
- What is Insurance Float?
- How Does Warren Buffett Use Float?
- How Do We Calculate Float?
- Examples of Insurance Float
What is Insurance Float?
We are all familiar with the terms premiums and claims; they are the money we pay yearly for an insurance policy and the money paid back to us when we have an accident, medical incident, or other circumstances.

But do you know what happens to the premiums once sent to the insurance company?
Insurers don’t pay out all the money right away. Instead, an insurance company will collect money in premiums, invest the money, and pay out claims as needed in the future.
The difference between premiums collected and claims paid out is the insurance float.
It is similar to how a bank will collect deposits, invest that money (through loans), and then repay it in the future with a withdrawal.
How Does Warren Buffett Use Float?
Here’s Buffett on the float:
Insurers receive premiums upfront and pay claims later. … This collect-now, pay-later model leaves us holding large sums — money we call “float” — that will eventually go to others. Meanwhile, we get to invest this float for Berkshire’s benefit. …
If premiums exceed the total of expenses and eventual losses, we register an underwriting profit that adds to the investment income produced from the float. This combination allows us to enjoy the use of free money — and, better yet, get paid for holding it. Alas, the hope of this happy result attracts intense competition, so vigorous in most years as to cause the P/C industry as a whole to operate at a significant underwriting loss. This loss, in effect, is what the industry pays to hold its float. Usually this cost is fairly low, but in some catastrophe-ridden years the cost from underwriting losses more than eats up the income derived from use of float. …
Our float has grown from $16 million in 1967, when we entered the business, to $62 billion at the end of 2009. Moreover, we have now operated at an underwriting profit for seven consecutive years. I believe it likely that we will continue to underwrite profitably in most — though certainly not all — future years. If we do so, our float will be cost-free, much as if someone deposited $62 billion with us that we could invest for our own benefit without the payment of interest.
Let me emphasize again that cost-free float is not a result to be expected for the P/C industry as a whole: In most years, premiums have been inadequate to cover claims plus expenses. Consequently, the industry’s overall return on tangible equity has, for many decades, fallen far short of that achieved by the S&P 500. Outstanding economics exist at Berkshire only because we have some outstanding managers running some unusual businesses.
Insurance float is one of the many reasons behind the success of Berkshire Hathaway. Because the premiums received are a little like a loan from policyholders, Buffett has used insurance float as leverage when investing in stocks or private companies, all of which have significantly impacted Berkshire’s return for its shareholders.
The use of insurance float is one of the reasons why Berkshire Hathaway’s book value and market value have grown 20% per year since 1965, compared to 10% per year for the S&P for the same period.
At the end of 2018, Berkshire Hathaway’s float had grown to $123 billion. The balance of $123 billion is all monies that Buffett can use to create more shareholder wealth for you and me.
How Do We Calculate Float?
Now for the fun stuff – how do we calculate float?
The major components of insurance float are:
- + unpaid losses and loss adjustment expenses,
- + life, annuity, and health benefit liabilities,
- + unearned premiums and other policyholder liabilities
- – less premium and reinsurance receivables,
- – deferred policy acquisition costs,
- – and deferred charges on reinsurance contracts.
All of the above is per the Berkshire Hathaway 2018 10-K. So what does all that gobbly goob mean?
Let’s take a deeper look and see what we can find.
Looking at insurance companies, we need to focus on the balance sheets; first, we will analyze the assets, then the liabilities.
Let’s look at Progressive (PGR) as our example. Before we begin, all numbers will be listed in millions unless otherwise stated.
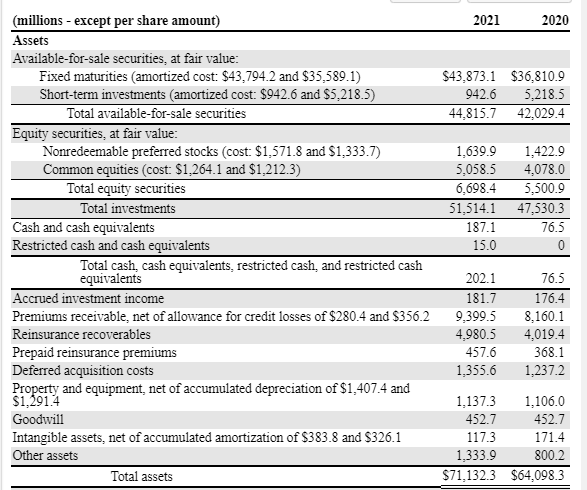
Looking at all that is a little confusing, so let’s make some simplifications. We’ll group all the investments (bonds, stocks) into “investments” and throw cash in there. Then we will create a category called “policyholders money we don’t have yet.” The category will consist of the following:
- Premiums receivable – future premiums to be received
- Reinsurance recoverable – money that the reinsurers owe
- Prepaid reinsurance premium – money already paid to reinsurers for future reinsurance policies
- Deferred acquisition costs – money already paid but not expensed, such as agent commissions and premium taxes, to acquire policies.
All the rest we will group under “Other assets.”
Now, our simplified assets portion of the balance sheet shall read:
- Investments = $51,616 million
- Policyholder’s money we don’t have yet – $16,191 million
- Other assets – $3,325 million
- Total Assets = $71,132 million
Now let’s look at the balance sheet’s liability side.
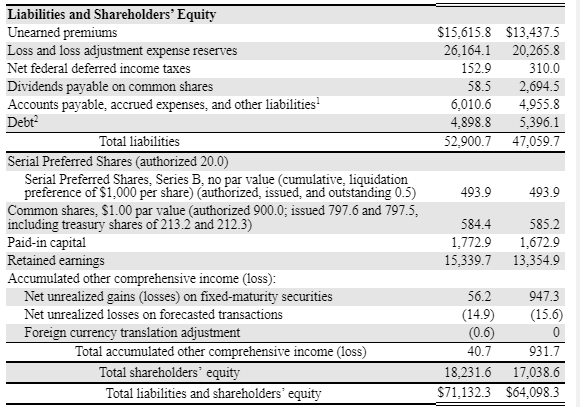
We will simplify the liabilities side of the equation just like we did for the assets.
First, we shall group them into four categories;
- Policyholders’ money that we have
- Debt
- Other liabilities
- Shareholders’ equity
Policyholders’ money that we have consists of:
- Unearned premiums – policyholder money paid for future coverage
- Loss and loss adjustment expense reserve – policyholder money set aside for already incurred losses, incurred but not reported losses, and the cost of settling claims.
- Other policyholder liabilities –in Progressive’s case, there aren’t any.
Lining up our liability side of the balance sheet will now look like this:
- Policyholders’ money that we have – $41,756 million
- Debt – $4,898 million
- Other liabilities – $6,247 million
- Shareholders’ Equity – $18,231 million
Now that we have simplified our balance sheet, calculating the float will be a breeze.
Float = Policyholders’ money we have – Policyholders’ money we don’t have yet
So plugging in our numbers from our simplified balance sheet from above, we get:
Float = $41,756 – $16,191
Progressive Float = $25,565 million
So, Progressive has an insurance float of $25.6 billion for 2021.
By simplifying the balance sheet as we did, we can see the different types of financing involved in an insurance company.
- Float is money that policyholders provide
- Debt is money that creditors provide
- Shareholders’ equity is money provided by equity holders
Now that we have outlined how to determine float for an insurance company, let’s look at some other companies to see how this works.
Examples of Insurance Float
First, let’s start with Principal Financial Group (PFG), based in Des Moines, IA, and started way back in 1879. Principal currently has a market cap of $22.2 billion and a market price of $91.69.
Let’s pull up their 10-Q dated 11/02/22 and start putting together the puzzle pieces.

Starting on the asset side of the balance sheet, we will find the policyholder money we don’t have:
- Reinsurance recoverable and deposit receivable – $22,893 million
- Premiums due and other receivables – $4,336 million
- Deferred acquisition costs – $4,834 million
- Policyholder money we don’t have total – $32,063 million
Now, for the liabilities side of the equation, let’s find the policyholders’ money that we have:
Contractholder funds – $43,618 million
Future policy benefits and claims – $43,577 million
Other policyholder funds – $1,007 million
Total policyholders money we have – $88,202 million
Now that we have simplified our balance sheet let’s look at the float for Principal.
Insurance Float = Policyholder money that we have – Policyholder money that we don’t have
Insurance Float = $88,202 – $32,063
Principal Insurance Float = $56,139 million
That was fun and surprisingly easy; let’s try another one, shall we?
Let’s look at Chubb Industries (CB), a property & casualty company based out of Zurich, Switzerland. Chubb currently has a market cap of $87.3 billion and a market price of $213.02.
We will use the latest 10-Q (quarterly report) dated 10/28/2022.
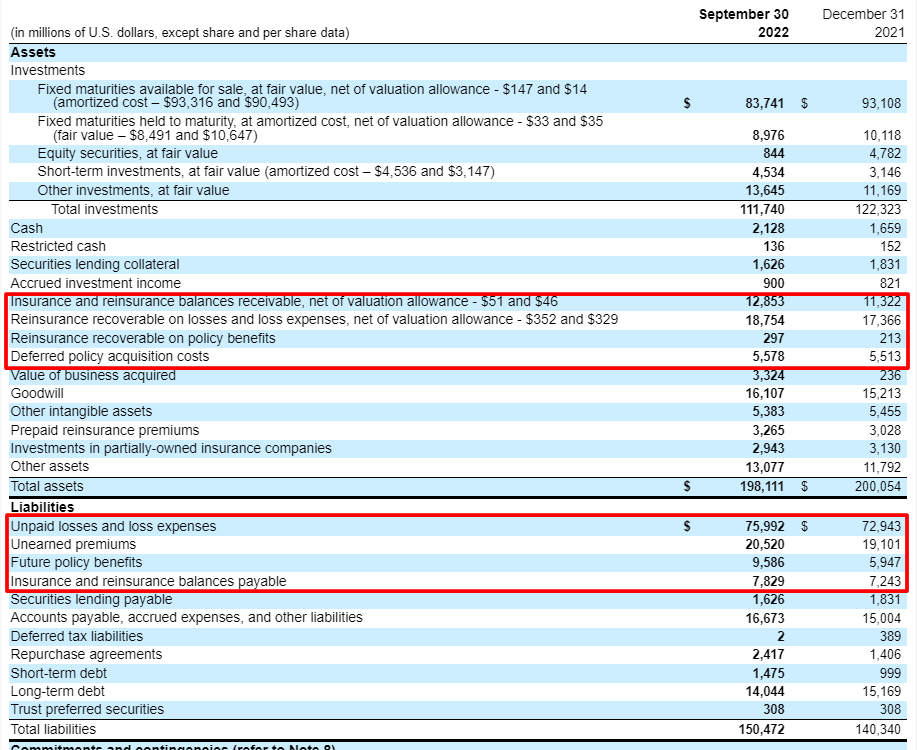
Now that we have our balance sheet in front of us, you know the drill.
Let’s look at the asset side of Chubb’s balance sheet.
- Insurance and reinsurance balances receivable – $12,853 million
- Reinsurance recoverable on losses and loss expense – $18,754 million
- Reinsurance recoverable on policy benefits – $297 million
- Deferred policy acquisition costs – $5,578
- Policyholder money we don’t have – $37,482 million
And finally, let’s look at the liability side of Chubb’s balance sheet:
- Unpaid losses and loss expense – $75,992 million
- Unearned premiums – $20,592 million
- Future policy benefits – $9,586 million
- Insurance and reinsurance balances payable – $7,829
- Policyholders money we do have – $113,999 million
Now that we have simplified our balance sheet, let’s figure out the insurance float available to Chubb Industries.
Insurance Float = Policyholder money that we have – Policyholder money that we don’t have
Insurance Float = 113,999 – 37,482
Insurance Float = $76,517 million available to Chubb Industries
I could do this for days; I love to look at companies’ financials. Yes, I am a dork; I get it.
I hope you have discovered how easy this is once we find a way to simplify our balance sheets to break down the financials into pieces we can understand.
Once you understand how the parts fit together, like a puzzle, it makes a lot more sense. And like any new language, the hardest part is learning all the language and putting our first sentences together.
Before you know it, you will be speaking insurance financials and able to value any insurance company that comes your way.
Final Thoughts
To recap, we have discussed what insurance float is, where to find it, and how to calculate it.
We credit Warren Buffett for bringing the term “float” into the public’s consciousness. He has been the loudest proponent of using this difference in policyholder money we have and policyholder money we don’t have.
Buffett has used this difference to create vast amounts of wealth for himself, as well as his shareholders.
To quote Danny Devito, “I love money more than the things it can buy, but you know what I love more than money? It’s using other people’s money.”
That phrase pretty much sums up insurance float and how it benefits insurance companies.
Insurance float and the combined ratio can help give a good picture of any insurance company’s profitability. The float helps us see and understand how our insurance company can take other people’s money to credit more profits for our company.
Using these funds to invest in securities, typically fixed-income investments such as bonds, help generate more profits for our insurance companies.
We have discovered how easy it can be to determine insurance float, especially once we simplify the balance sheet into pieces that we can understand and use to calculate the insurance float.
A little homework for you: take a stab at calculating the insurance float of Allstate (ALL) and Aflac (AFL) using the latest 10-K’s and let me know your results.
As always, thank you for taking the time to read this post, and I hope you have something of value to help you with your investing journey.
Please let me know if you have any questions or need further help to decipher the insurance float.
Take care,
Dave

Dave Ahern
Dave, a self-taught investor, empowers investors to start investing by demystifying the stock market.
