There are more than a couple of methods which can be used to get an estimate of the growth rate for a company. Some can be opinionated while others are built on logic and numbers. It is always prudent for investors to look at valuations and potential returns from a conservative viewpoint that is anchored in logic, understandable and reasonable. Doing so will help investors avoid overpaying for high-flying growth stocks. This article will go over two such reasonable growth rates, the common internal growth rate (IGR) and the sustainable growth rate (SGR), using Coke as an example to calculate each.
Internal Growth Rate (IGR)
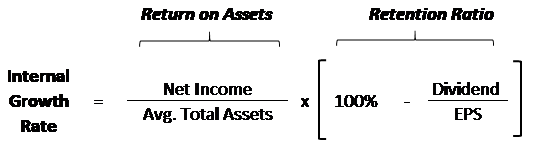
A company’s internal growth rate is the growth that can be achieved without issuing additional equity or debt financing. Internal growth is achieved using only retained earnings not paid out as dividends to invest in new assets. Since no capital is needed from outside investors, it is referred to as the “internal” growth rate.
As can be seen in the formula below, the IGR formula calculates growth by analyzing the net income that the company’s assets are able to achieve, called return on assets (ROA). The portion of retained earnings is reinvested in new assets that will then earn the same ROA.
Internal Growth Example with Coke
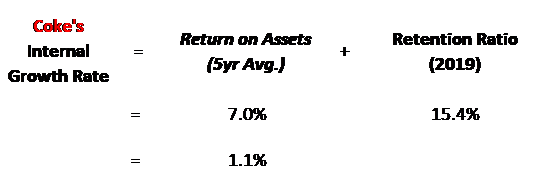
Coke’s ROA of 7.0% over the past 5 years means that the retained 15.4% of net income not paid out as equity can be invested in assets that will earn this 7.0% return.
As can be seen below, Coke’s internal growth rates can be calculated to be only a measly 1.1%.
This low rate is driven by not the ROA, as 7.0% is an impressive return to be earning on assets, but is instead driven by the low retention ratio of 15.4% net income. The retention ratio is so low as Coke is a relatively mature company and paid out 84.6% of its income to shareholders in the most recent year.
Sustainable Growth Rate (SGR)
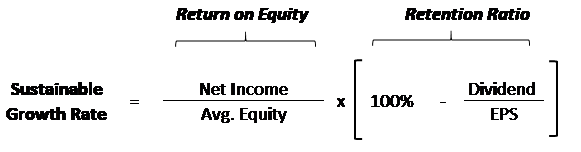
A company’s sustainable growth rate is the growth that can be achieved without changing the capital structure of the business.
This does not mean that additional debt will not be issued, it instead means that additional equity retained will also allow the business to raise additional debt and thus keep the overall capital structure the same. If assets are leveraged 2x, they will continue to be leveraged 2x as every $1 of equity retained in the business will allow the business to raise an additional $1 of debt in order to then invest $2 in assets.
This change from unleveraged assets to leveraged equity is made in the formula for sustainable growth by changing the first portion of the formula to be return on equity (ROE) rather than ROA.
As can be seen in the formula below, the SGR formula calculates the growth rate by analysing the net income that the company’s leveraged equity will be able to achieve. The amount of earnings retained as equity is assumed to be able to earn this same leveraged return. As the SGR is a leveraged ratio that contains debt, SGR will always be higher than the IGR which is unleveraged …unless the company is unprofitable.
Because the SGR is more realistic and takes into account leverage, it is the preferred growth rate and the one that IFB’s pre-built financial model uses to automatically add growth into valuations. For investors interested in a pre-built financial model where they can punch in the financial data of any company of interest, they can check out our financial model and valuation template!
Sustainable Growth Example with Coke
As expected, the SGR for Coke is higher as it assumes the business will continue to raise debt proportionate with retained earnings in order to buy new assets with both equity and debt. With assets being 455% of equity at Coke, the business is highly leveraged and thus can achieve a nice SGR of 4.5% from any retained earnings. This high level of leverage is also witnessed by ROE being much higher than ROA.

Limitations of Growth Rates
No ratios are perfect, and a ratio as important as a growth rate deserves extra scrutiny. Besides being backwards looking, the growth rate calculations also assume certain metrics will stay constant. High growth and higher returns tends to attract competition in the industry which can chip away at profitability. Below are some of the main assumptions that are made in the growth rate equations:
- Profitability and Returns: Assumes a constant return on assets which could be affected for many reasons such as a change in the cost of goods sold or a change in pricing power due to competitive pressures.
- Capital Structure: Assumes a constant capital structure when most businesses will change their capital structure according to the cost of debt.
- Payout Ratio: Assumes a constant payout ratio which is fine if the business is mature but new and smaller businesses will be retaining more income for growth opportunities and then slowly tapering the amount of retained earnings down as the market matures.
- Cost of Debt: The cost of debt changes over the years and its rate can effect both the profitability of the company as interest expense changes, as well as the businesses choice surrounding how much to leverage assets.
Takeaway
Both the internal growth rate and sustainable growth are good methodical ways to estimate growth. The internal growth rate is the more conservative measure of the two as it does not assume any additional debt is issued. The sustainable growth rate is probably the most realistic growth measure of the two, in my opinion, as any responsible management would be appropriately leveraging assets.
Taking the equal average of the two, Coke’s growth rate would be 2.8%. This is right around my 3% rule of thumb for a strong and mature company that should be able to grow with the economy. Any growth rate needs to be compared to GDP and growth rates well above the long-run rate of GDP (ie. +3%) should be considered only short to medium term. In order to grow above the rate of GDP growth and inflation in the long-term, a company needs to have a big economic moat to fend off competition.
