There are two main types of off-balance sheet items for investors to consider. One regards future obligations, and one regards potential off-balance sheet risks. These can be critical towards understanding the true potential of a company’s future free cash flows, and are found in a company’s 10-k.
While there’s no official categories for the two main types of off-balance sheet items which I’ve observed, we can think them as one of the two buckets:
- Future obligations (rent, POs, debt, etc)
- Major financial risks (credit, counterparty, etc)
The reason why these types are “off-balance sheet” is because, well, there’s generally no line item to correspond with these real obligations or risks.
Future obligations: Recently, the FASB changed the rules around operating leases in order to require a separate balance sheet item to account for the long term liabilities that an operating lease represents.
But there are still other aspects of contractual obligations which are not represented as a long term liability on the balance sheet (such as the interest expense owed over the life of a senior note), and thus they need to be disclosed in the off-balance sheet section of a company’s 10-k.
I went over how to find the contractual obligations (in the off-balance sheet section) of a 10-k previously, which I recommend reading also to get insight on these key items.
Major financial risks: When it comes to understanding the potential risks involving (sometimes) exotic financial instruments which also don’t show up on the balance sheet, you’re going to want to deeply understand the sections covered here.
This post will cover the following key points to learn around off-balance sheet items:
- Introduction to Off-Balance Sheet Risks
- Counterparty Risks (Off-balance sheet item)
- How to Find Off-Balance Sheet Items from the 10-k (Goldman Sachs Example)
- Interpreting Off-Balance Sheet Items for Finance Companies
- Evaluating Credit Risk Through Off-Balance Sheet Items (JPM Example)
- Investor Takeaway
Go through these steps at your own pace, but I do recommend going through in the correct order. You’ll get some important background to how these major financial risks have really affected the economy and the businesses involved (and it wasn’t all that long ago either).
Introduction to Off-Balance Sheet Risks
A company (especially in the financial industry) may purchase derivatives to hedge against interest rate, currency, or credit risks, or may sell derivatives as income-producing investments.
The risks behind being involved in derivatives were highlighted gravely during the financial crisis, as countless mortgage-backed securities defaulted and erased the value of many derivatives.
The great book All the Devils Are Here outlined how and why banks used off-balance sheet items to mitigate risk on their loan books, which took the form as a “credit default swap”.
A credit default swap (or CDS) is a type of derivative where the seller takes the credit risk from a loan, and charges interest to the buyer. Those of you familiar with options can think of a credit default swap as similar to a put option; the seller assumes the downside risk and is compensated through premium.
If a loan defaults, the seller of the CDS must reimburse the buyer of the CDS for the full amount of the loan, as a requirement of assuming the credit risk.
Essentially, the reasons that many big money banks purchased credit default swaps was two-fold:
- By buying credit default swaps they could offload the risk of default to a third party (counterparty). This led to banks lowering loan standards, since they were not directly responsible for the default risk. Lower loan standards means more loan generation, and revenue.
- By shifting the risk of default to a counterparty, the bank could erase the capital requirements (funds held in reserve) to satisfy bank regulators and thus, make more loans and revenues.
This all started from off-balance sheet items being used to reduce capital requirements on the loan book (reason #2 above), which led to the wide-use of mortgage backed securities (MBS).
Banks would make a mortgage loan for example, securitize the loan (into an MBS), and sell it to Fannie or Freddie and greatly reduce capital requirements required under Basel I (the Fed’s cash in reserves requirements).
The banks could then take it a step further and sell a risky MBS to an off-balance sheet investment vehicle (which would be purchased by a Wall Street firm), and reduce the capital requirements to zero (!) by working a loophole on short term credit lines and off-balance sheet rules.
Counterparty Risks (Off-balance sheet item)
What gets even more sticky about CDS’s are the counterparty risks.
So whether you are a buyer or seller of CDS, you have counterparty risk in addition to the downside credit risk for the seller.
Buyer risk: If the seller goes bankrupt, you might not get paid out for any loans that default which you bought CDS protection from.
Seller risk: If the buyer goes bankrupt, you might no longer receive the expected income over the life of the CDS, which could cause an impairment to your financials.
The presence of these risks may change over time due to regulation, but at the time of the Great Financial Crisis these were the risks—combined with the vast usage and interconnections of MBS’s, CDS’s, and CDO’s (Collateralized Debt Obligations, basically packages of groups of MBS’s)—which greatly contributed to the market collapse and almost complete destruction of the system itself.
Whether the company you are examining has counterparty risk, credit risks, or any other risks associated with their buying or selling of any off-balance sheet derivatives, these should be outlined and disclosed in an off-balance sheet section of the 10-k.
How to Find Off-Balance Sheet Items from the 10-k (Goldman Sachs Example)
Banks which make loans and financial service companies which wish to earn income tend to the ones you’ll see which utilize derivatives the most, whether they are buying or selling them.
We’ll take a look at a couple in these industries, starting with Goldman Sachs ($GS). From their 10-k released in 2020:
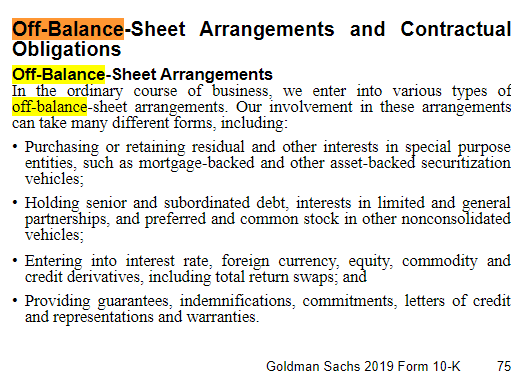
To find this section I simply searched (with “ctrl+f”) the term “off-balance” to find the specific section which should be located in the MD&A.
Let me try to translate those 4 bullet points into easier to understand language:
- Types of off-balance sheet arrangements
- Buying MBS’s as an investment to earn income
- Holding debt, or assuming obligations through subsidiaries (with less than 50% ownership)
- Buying or selling derivatives such as CDS’s
- Providing access to cash through a line of credit or other instruments (or transactions)
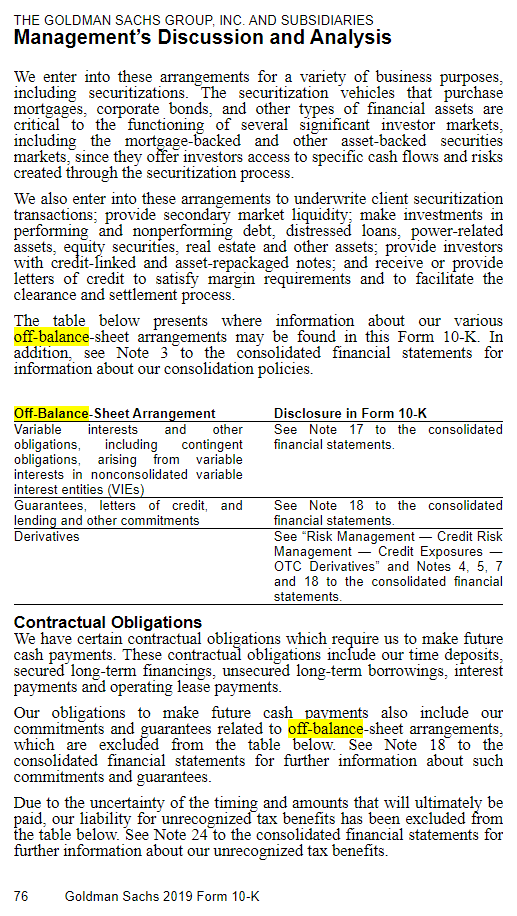
You might notice references to various Notes to the Financials, which should also be examined as a critical part of truly understanding some of the inherent risks involved with the items.
For Goldman, the next page of the 10-k outlines where to find some of these disclosures:
Interpreting Off-Balance Sheet Items for Finance Companies
What makes a company like Goldman Sachs (and other integrated financial companies like JP Morgan) confusing is that they have various business segments which earn income in different ways.
For example, the company might hold deposits like a traditional bank, and decide to earn income from these deposits by buying investments such as MBS’s rather than loaning them out.
The bank might also buy CDS’s for their loan book, and/or sell some of their MBS’s (to Fannie or Freddie for example, who guarantees the mortgages), to off-load some of the credit risk, which explains why they might be both buyers and sellers of MBS’s.
The company might additionally have an investment banking segment which essentially collects fees from organizing the sale of a bond for a large corporation, and there may be certain guarantees or indemnifications (offloading of legal liability) associated with the transaction.
While all of that is going on, another segment of the bank (like a trading desk) might be involved with buying derivatives to hedge against some of the other trades they’ve made, which operate as an entirely autonomous business and seek profits solely through making good trades.
All of these transactions could be happening simultaneously at a large banking conglomerate like JP Morgan, which can make it both difficult to understand the true risks of an investment in the company and/or create conflicts of interest between various of their clients served through their different segments and services.
Evaluating Credit Risk Through Off-Balance Sheet Items (JPM Example)
We talked about how a big part of off-balance sheet risks can relate to credit risk, which is particularly prevalent for a commercial bank focused on collecting deposits and writing loans.
This is especially true for JP Morgan, who has a long reputation for wanting to manage risks in its loan book, and outlines these extensively in their 10-k.
They are much more of a “traditional” bank than Goldman Sachs is, so it makes for another good example of how off-balance sheet activities can play into analyzing a financial company’s statements.
Diving into the 10-k for JP Morgan released in 2020, we can observe this section on credit risk:
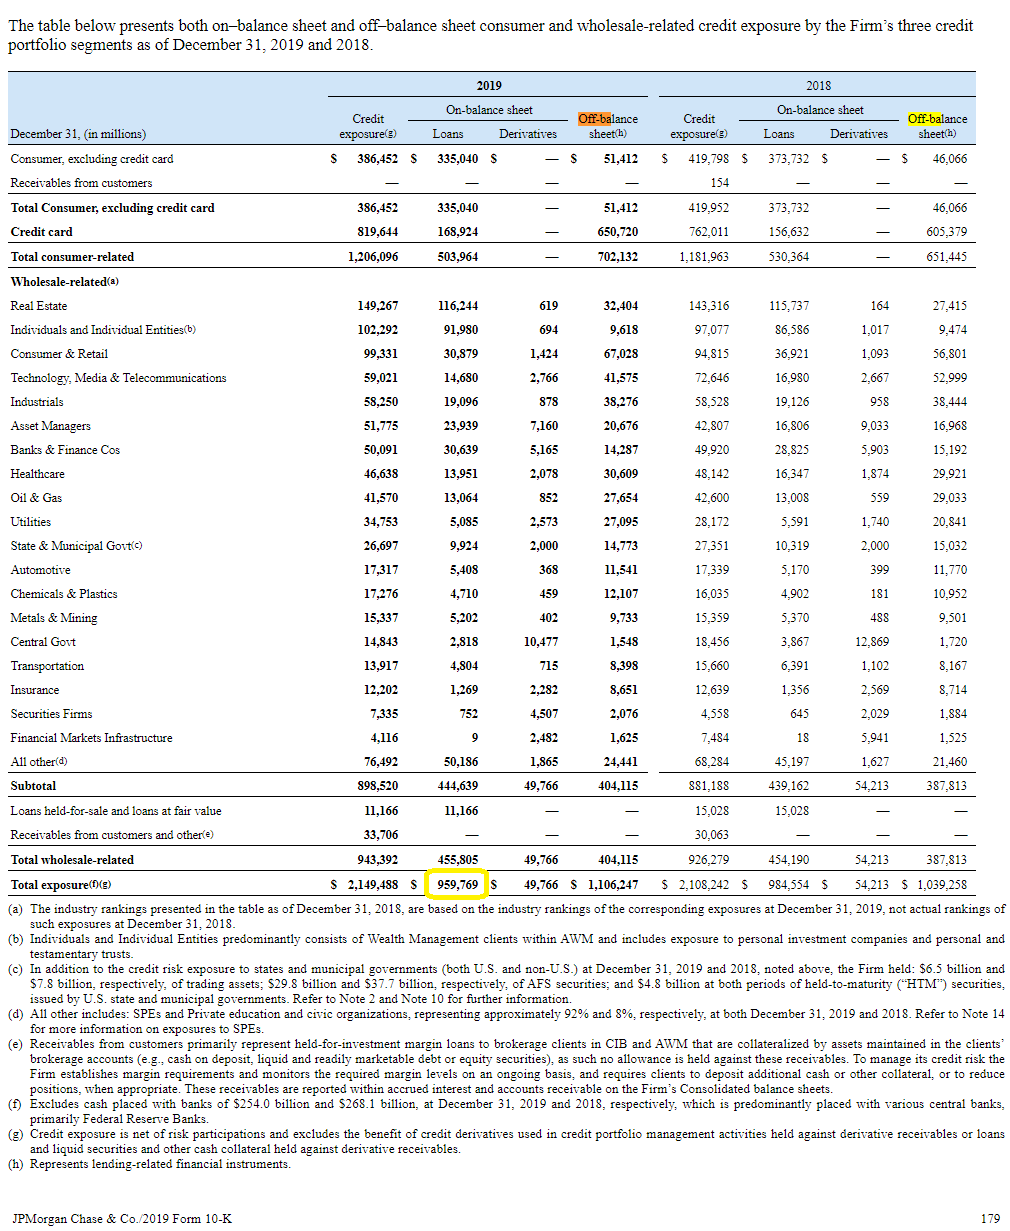
Note that the company has $959,769 million of loans (net) on its balance sheet (long term asset), and with this note we can see the true exposure that their loan book represents.
Of course this represents a sort-of worst case analysis, but can be helpful nonetheless especially when comparing with other more traditional-like commercial banks.
Another key part of off-balance sheet items for financial companies is in its role in calculating leverage ratios which are required by Basel III—specifically the SLR, or supplementary leverage ratio.
The formula for SLR:
SLR = Tier 1 Capital / Total Leverage Exposure
Where, Total Leverage Exposure is the combination of off-balance sheet and on-balance sheet assets exposure generally represented by a company’s credit portfolio.
To really understand the implications of calculating SLR I’d highly recommend these two posts:
- Tier 1 Capital – The Easy Way to See the Strength of a Bank’s Balance Sheet
- What is SLR and how is it calculated? | GlobalCapital
The bottom line is that as a bank holding company, JP Morgan must maintain adequate capital reserves which are set on a global level by the Basel Committee.
SLR is one of the many leverage ratios which calculates that, as a way for regulators to increase the safety of the overall banking system and decrease the chances of another widespread crisis (within the banks themselves).
Here’s how JPMorgan calculated SLR for their company:
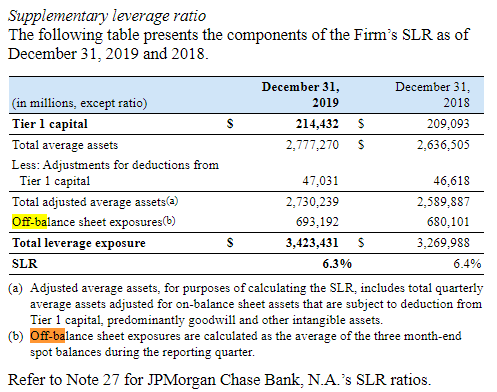
Note that these off-balance sheet exposures are different than the “credit risk” exposures examined above. JPM doesn’t make it clear the difference, while Goldman defined their average off-balance-sheet exposures as the following:
Average off-balance-sheet exposures represents the monthly average and consists of derivatives, securities financing transactions, commitments and guarantees.
If I was investigating JPM as a potential investment I’d try to look into this discrepancy, as their total Off-balance sheet exposure in the Credit Risk table summed to $1,106,247 million while their Off-balance sheet exposures for the SLR calculation summed $693,192 million. Though, Note (g) in the Credit Risk table says that the benefit of credit derivatives have been excluded, which may describe the discrepancy.
Investor Takeaway
Hopefully this post has given you insight into how to better understand the risks associated with off-balance sheet items for companies in the financial industry.
It was extensive use of off-balance sheet items such as credit default swap derivatives, and on and off-balance sheet items like mortgage-backed securities, which caused several well-known firms to implode and others to tumble greatly.
While regulation has improved particularly with Basel III, there’s always the risk that financial instruments become more risky especially as financial innovations continue.
That is, after all, the nature of finance—creatively finding new ways to increase profits by sometimes taking exotic risks.
As investors, we can never hope to exclude all risks from the companies we invest in, but we can hopefully be more aware of the actual risks represented by a bank or other financial company based on what it is currently disclosing in its 10-k.
After all, during the Great Financial Crisis there were several “canaries in the coal mine” (warnings of impending doom).
You might not always be ahead of these canaries, but perhaps you can increase your chances by getting to intimately know the various sections of the 10-k of the company you own, starting with and including the different off-balance sheet items and activities.
For more help on understanding financial statements for publicly traded companies, be sure to check out other posts we’ve done as well, such as this 10-k guide:
It’s impossible to remove all risks with investing; risk is part of the game.
But to really invest with a margin of safety, emphasis on the safety, means really understanding the businesses you invest in—and so commit to constantly learning about businesses and the key parts of financial statements.
