Compound interest is the key to all investment returns, and it especially instrumental in its role for generating massive returns on the best growth stocks. But there’s a limit to compound interest called the law of large numbers, and we’ll talk about examples of this law applied on two very big businesses—Microsoft and Amazon.
This post goes pretty deep into valuation, with various more advanced stock metrics applied, in order to (hopefully) belabor the point that the law of large numbers should not be applied as a blanket statement on any business.
Because large compounding rates tend to apply to the highest and fastest growing businesses, the limitation of compounding due to the law of large numbers tends to apply more to growth stocks rather than value stocks.
And so, this law is sometimes broadly applied to exclude some of the best businesses.
I know because I’ve done it myself.
But I hope that with this law of large numbers example we can open our minds to places where this rule has better practical application than others, and use it to assist in finding the best compounding opportunities rather than completely exclude them.
At the same time the law of large numbers is an extremely useful tool to avoiding very large drawdowns in the market, which happen most often with the most expensive growth stocks.
Let’s use these two examples as a model for understanding the best use of the law, and applying it in the most useful way.
Introduction to The Law
While mathematics can be extremely helpful in conceptualizing the power of compounding and investment results, it can also be misleading if misapplied without proper context.
For example, any company growing at 20% per year, or 4x-5x the overall U.S. economy, will someday see its growth slow—otherwise it would grow larger than world GDP.
Growth at 20% becomes harder to maintain at $200 billion than it is at $2 billion, generally, because of the large amounts of capital implied at each level.
20% growth of $200 billion would require at least $40 billion of additional revenues (assuming a 100% profit margin), while that same 20% growth rate on $2 billion would need factors of ten less, around $400 million if assuming similar margins.
While finding $400 million of revenues might not be too difficult in many swathes of the economy, there aren’t many industries where $40 billion of product sales or services are easily available for the taking by large business conglomerates.
At a certain point, companies (b2b consumers) only need a certain amount of technology hardware or software… consumers (people) can only spend a limited percentage of disposable income…
There becomes a limit on revenue (and thus profit) potential due to the realities of the economy and real TAMs (total addressable markets), that becomes more evident the higher we zoom out with the mathematics.
This real world limit on the economy and revenue potential is called in mathematics the “law of large numbers”, and is best applied when projections of future compounding cannot be sustained because they are too high, too far out in the future, or some combination of both.
The Law and Growth Stock Valuation
This growth paradox in the law of large numbers is especially applicable in DCF valuation models.
Just as there’s a real, mathematical limit to a company’s revenue streams, this naturally flows to a real, mathematical limit to a company’s growth in free cash flows, which puts a limit on its valuation (if based on a DCF estimating FCF).
After all, a company can’t earn a higher profit (or FCF) margin than 100%.
While a commonly held belief about stocks is that the downside is capped and the upside is unlimited, in reality it’s only the speculative nature of the markets which has this seemingly “unlimited” potential. For the underlying businesses behind a stock ticker, there is a real growth limit wherein a large size actually hurts more than it potentially helps its shareholders.
Law of Large Numbers Example: Microsoft
Take Microsoft as an example. If we were to take some basic reverse DCF assumptions, such as a 6% discount rate and $6.59 per share of trailing free cash flow as an example, then at $241.84 the market is expecting a 15.08% growth rate of free cash flow per share.
Let’s assume the company is able to achieve this 15% growth of free cash flows over 10 years (standard DCF assumptions) by doing some combination of the following:
1. Growing revenue
2. Improving margins
3. Buying back shares
From 2011- 2020 the company’s Free Cash Flow margin range was 25.4%- 39.8%. This seems to be pretty wide, which can indicate times where the company was more aggressive or conservative with capex.
Net margin also faced a similar swing, which could be attributed to differences in tax credits or charges, along with other one-time items.
I think operating margin gives a better range: 29.8%- 38.8%. A company can improve operating margin quickly by reducing SG&A expenses or improving gross margin.
With 2020 operating margin running pretty efficiently at the higher range (37%), maybe the company can gain 1-2% of their FCF 10y growth by a permanent 1-2% improvement in that operating margin.
Considering the company’s serious pricing power (their Office suite of software products and stickiness of Azure), higher revenues on the same amount of expenses (leading to margin improvements) could reach (and maybe even surpass) historical levels of similar margins.
This might be an optimistic, though certainly not ridiculous, assumption.
Over the past 5 years, Microsoft reduced shares outstanding by 6.9%. On a per year basis, this equates to a -1.4% reduction in shares per year, which would be directly accretive to FCF/share growth. So based on factor #2 and #3, an estimate of 2- 4% growth in FCF/ share over the long term solely through margins improvement and buybacks is palatable.
That leaves the last factor, revenue growth, which if not directly pushing up margins will likely be attained by higher volumes.
Those higher volumes can happen directly through acquisitions, through stealing market share from higher capex or operational spending, or by simply participating in the rapid market growth of an industry.
The question (regarding Microsoft and the law of large numbers) is:
Assuming the 4% growth of the other 2 factors, is 11% growth of revenues through volume possible for a large company of Microsoft’s size?
We could here make the affirmative case for a company with only $153B in revenues (TTM). A growth of 11% in revenues over 10 years would turn their $153 billion into $435 billion. Comparing this to the overall U.S. economy, call it $21 trillion today, growing at 4% to $30 trillion in 10 years, Microsoft at $435 billion sounds reasonable.
It’s at least not an impossible feat—consider that Walmart (albeit a retailer with different economics) has over $500 billion in sales right now.
Thinking about Microsoft’s industry…
Their most attractive services today are sold to businesses (b2b), through their Office (now Microsoft 365) and Azure offerings. With gross private domestic spending (spending by businesses) in the U.S. at $2.8 trillion and growing around 6% per year, we could be looking at a figure closer to $4 trillion in 10 years.
Does the Law of Large Numbers Apply to Microsoft today?
Now we need to answer the 11% question. Is it reasonable to say that Microsoft could “own” $435 billion of a $4 trillion business spending market?
It could, if businesses across the U.S. are spending 10% of their business investment into the infrastructure services Microsoft provides (and Microsoft has 100% share), or if companies in the U.S. are spending 20% and Microsoft has 50% share.
Or… more likely is that some of the $435 billion in sales for Microsoft gets absorbed by the consumer market (through their video game products like Xbox and Minecraft), and the company needs less of the business spending market.
Another important consideration is international spend, and how much Microsoft can take there.
But the bottom line, based on the mathematics as they stand today, is that maybe Microsoft isn’t too big to grow at 15% over the next 10 years.
At a certain point, the company might run into that trouble. Other big businesses in the stock market today might see their growth potential more limited, due to either their limited TAM, ability to steal market share, or any other relevant factor. Regardless, this kind of an exercise is worth considering when looking at the largest companies as investments, and should be part of a good DCF analysis.
Law of Large Numbers Example: Amazon
Let’s compare this to another large company with one segment in a similar industry, Amazon (and its operating segment in the cloud, AWS).
If we were to take some reverse DCF assumptions based on its recent market price, $3253.18, and assume a 2020 FCF of $50.83 per share and a 7.5% discount rate—then the market is currently implying a 25.23% growth rate over the next 10 years.
This high implied growth rate for Amazon makes for another good law of large numbers example as you contrast it to Microsoft’s.
Recall the three possible ways that Amazon can grow FCF per share: (1) improvements in FCF margin, (2) reducing shares outstanding through stock buybacks, (3) revenue growth.
Over the last 10 years, Amazon has made strides by leaps and bounds in their FCF margins—which makes sense because for many of those years the company has been a growth company.
In fact you can argue that the company has been a growth company the entire time, which makes their improvements in FCF margin over the last 5 or so years that much more impressive.
The following shows Amazon’s YOY revenue growth over the last 10 years:
- 2011: 40.6%
- 2012: 27.1%
- 2013: 21.9%
- 2014: 19.5%
- 2015: 20.2%
- 2016: 27.1%
- 2017: 30.8%
- 2018: 30.9%
- 2019: 20.5%
- 2020: 37.6%
From all bases of historical growth, Amazon does not appear to be slowing down with their revenue growth one bit.
For this company, it’s the possible plateauing from the law of large numbers that is the company’s biggest threat to its current high valuation.
To really understand the extent that Amazon faces this risk requires understanding the company’s business model, through a similar analysis to a sum of the parts valuation.
Like Microsoft, Amazon has two separate customer markets for its different segments:
1. The average consumer for their retail operations
2. Businesses of all sizes through their AWS cloud services
While the company as a whole has grown FCF margin from the low single digit range in the early 2010’s to the high single digits as of late, this metric is arguably less useful on a company level than it would be on a segment level.
Let’s go back to Amazon’s segments and pull some of the latest revenue numbers (from their 10-k):
1. North America = $236.3 billion
2. International = $104.3 billion
3. AWS = $45.3 billion
Their operating income segment numbers, while not a substitute for FCF margin, gives a decent insight into how much free cash could possibly be squeezed from each segment (with a rough calculation for operating margin included):
1. North America = $8.65 billion; 3.7% operating margin
2. International = $0.72 billion; 0.7% operating margin
3. AWS = $13.5 billion; 29.8% operating margin
Comparing Amazon’s AWS segment to Microsoft’s general operating margin, which remember was around 30%- 40%, we can maybe half hazard a guess that AWS has some room for margin expansion.
Since cloud services require a capital intensive build-out, and keeping up with technology hardware upgrades is a constant significant expense, you could argue that more capex is required versus a technology company with little maintenance capex, such as a software company (Microsoft’s Office suite).
But, since cloud/ data center infrastructure is a pretty sticky business model, at least some margins expansion should be easily achieved with scale, as the cost to keep a customer with growing data/compute needs should be cheaper than acquiring new customers outright.
Maybe AWS never reaches Microsoft’s software margins level, but maybe it’s able to split the difference, which would still represent 5% permanent growth if sustained, and isn’t out of the realm of possibility for quantifying potential future growth.
For sure, the $45.3 billion of Amazon’s AWS revenue doesn’t fall into the law of large numbers problem, as we estimated a potential $4 trillion TAM and even 25% of AWS revenue growth over 10 years would calculate to $424 billion and looks achievable from that TAM estimate.
If AWS’s operating income represents a little over half of the company’s total operating income, then a rough 5% increase in operating margin over the long term would increase total company operating margin by 2.5%- 3% all by itself if it was able to be achieved.
Moving on to the company’s retail (North America) segment, the possible operating margin expansion is less clear from a competitor comparison standpoint—since their retail business is so unique and innovative.
Amazon versus its Competitors
While Walmart might share similar consumer demographics, Walmart makes its free cash on its small margins.
Amazon doesn’t seem to solely focus on the margins of its higher turnover inventory itself, but it also collects an annual membership fee through Amazon Prime which has its own pricing power (and thus margin expansion opportunities).
A good comp (comparable) to this could be Costco and their tiers of customer membership plans, but the CEO for Costco has been very public about the company converting the higher margins from its membership pricing power and reducing the gross margins on the inventory it turns over. An investment in the growth of Costco is not a margin expansions play, but rather strong revenue growth from continued higher volumes supported by its ability to thrive with razer thin margins on its inventory.
This story about Costco becomes evident when you look at their historical gross and operating margins over the last 10 years, and how much it has stayed consistent and barely budged from year to year despite pricing increases in its membership plans.
If we were to assume that Amazon’s retail segment can increase its operating margins by incrementally increasing the price of its Amazon Prime service, then maybe it can match a potential 5% growth in operating margin of AWS which we estimated earlier, leading to an increase of 5% in operating margin for the entire company.
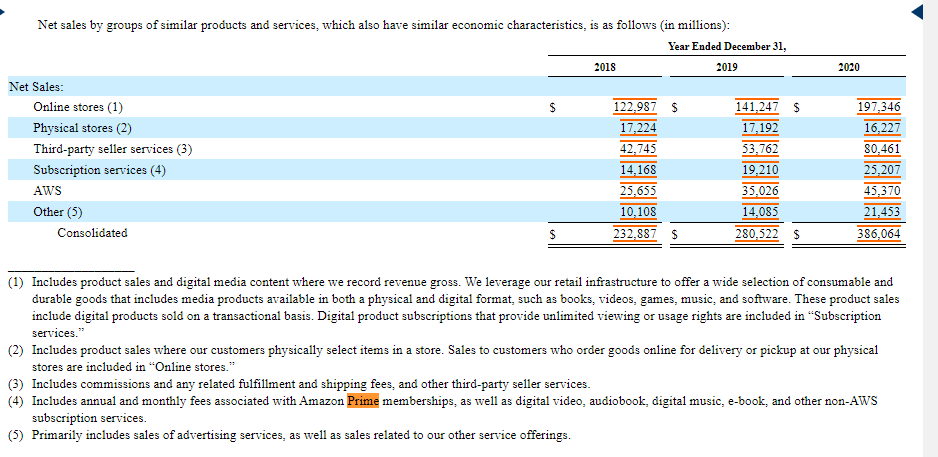
Looking at a screenshot from the latest 10-k, it appears that sales from Amazon Prime and other related services have not slowed down even as the number of North America customers has potentially saturated:
Since the company has been diluting shares to support their growth rather than buying them back, we might cancel out the higher margins improvements estimates with the dilutive nature of continuing to issue shares to support its extremely high revenue growth.
This leaves the 25% growth question for Amazon as the following:
Can Amazon continue 25% growth in free cash flow per share over the next 10 years, either by continuing a blistering revenue growth pace, slowing down its share dilution, improving margins, and/or doing some combination of all of it?
Or will the law of large numbers limit this potential?
For Amazon to continue its dilutive path and become solely a revenue growth story, it would need to grow revenues to $3.5 trillion by year 10 to match its current valuation—assuming any margins expansion cancels out any future share dilution.
The more likely story is that the company can maintain some margins expansion while keeping shares outstanding flat (or even adding buybacks), which could reduce that $3.5 trillion requirement to something like $2.4 trillion or $1.5 trillion (revenue growth rates of 20% or 15%).
But there’s a lot of “ifs” in that statement, and the law of large numbers seems to be limiting Amazon more than it does Microsoft, at least as it relates to justifying current valuations.
It’s harder to picture even a $1.5 trillion revenue level versus one of $435 billion, as there’s simply a ceiling to both discretionary customer spending and business investment spending.
Takeaways from these Examples
The point of examining these big businesses and the possible law of large numbers effects on them is not to make an investment case for or against either Microsoft or Amazon, but to prompt further thinking into how we apply the law into our investment theses.
You can see that much of this is subjective, and requires a certain level of competence on the businesses you are examining.
Unless a company has a simple business model and a single segment, it’s likely you’ll have to apply some sort of separate analysis on each business segment, which further complicates things and makes metrics like total sales, earnings, and related P/S and P/E’s less helpful in understanding high growth rate valuations.
But because so much of assuming high growth rates over long periods of time requires many things to go right for a company, a consideration of something like the law of large numbers should NOT be ignored.
High growth rates can result in fantastic wealth generation through the nature of compounding, but this compounding should NOT be extrapolated indefinitely into the future—and this becomes more prevalent as you look at high growth rate businesses.
I’m not saying that all high growth businesses and valuations should be ignored, but that more out-of-the-box analysis should be done on them.
Common sense, and a zooming out of perspective, can help investors avoid the most unreasonable growth stock valuations and greatly increase the chances reducing big drawdowns and thus—maintaining the highest compounding of your portfolio over the long term.
