A DCF sensitivity analysis is a fantastic way to estimate valuation on a company because it gives you a range of intrinsic values instead of just one steady state number. DCFs inherently rely on future assumptions, and we can’t be precise on these (because the future is unknown), so it’s better to estimate them with a range of values.
Creating a DCF sensitivity table in your Excel valuation spreadsheet provides a quick and easy way to visually see how varying inputs lead to a final intrinsic value estimate.
From there, you can quickly calculate a range of intrinsic values, as well as edit your sensitivity table inputs and observe instant updates to these values.
This type of analysis is a very visual one, and so let me first provide you a visual of what it should generally look like:
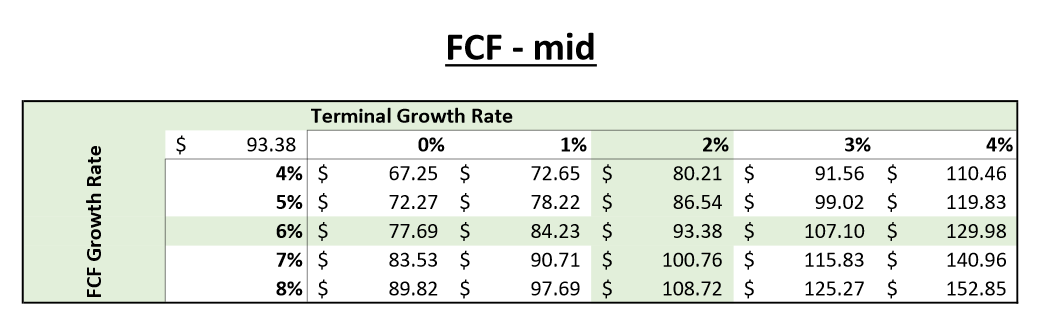
You can see how the top row provides us the option to vary the terminal growth rate, from 0% – 4% in increments of 1%. You can easily update this range however you please, down to multiple decimal points if you desire.
Notice how even just a 1% change in the terminal growth rate leads to huge swings in valuation, which really highlights how important this assumption is.
The FCF growth rate estimate is a DCF input that most analysts spend much time on, and you can see its impact on the intrinsic value as you move from percentage points. Notice how the 1% change in the FCF growth rate provides less of an impact than the 1% variance in terminal growth rate. But, this can also depend on
Here’s a visual of what a big picture DCF sensitivity analysis looks like with 3 (!!) variables—within a complete valuation spreadsheet:
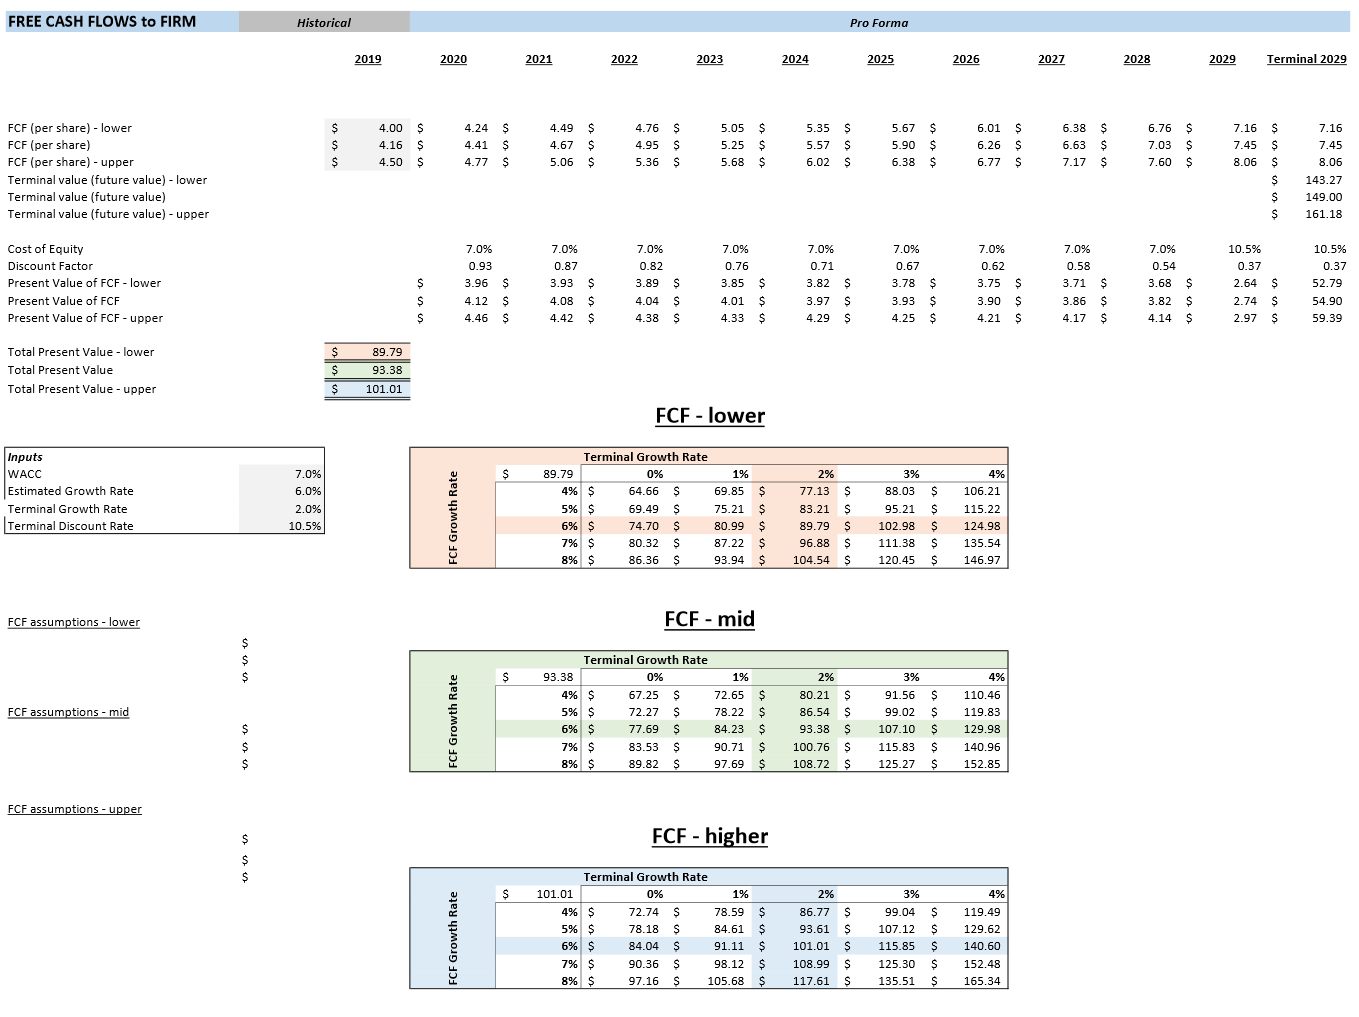
Click to zoomTo create this 3-variable DCF sensitivity analysis spreadsheet, I used Cameron Smith’s excellent IFB Equity Model spreadsheet template (in Excel) as a base for the DCF calculations.
This IFB tool was an essential step for me personally in learning the power of sensitivity analysis within a DCF calculation, and I highly recommend using (and customizing!) that spreadsheet yourself instead of blindly relying on any online DCF shortcut tools.
I simplified some of the rows and columns from Cameron’s tool, crafting it into the way I like to run a quick DCF. You can use his model as-is or edit it as you please.
The gray boxes are my inputs, and the red, green, and blue boxes are my outputs, depending on the 3 FCF/ share inputs I put into the 3 gray boxes at the top of the spreadsheet.
Once you have the DCF spreadsheet presented as you like, it’s time to build the sensitivity table like the one titled FCF – mid, using the “What-if Analysis” function in Excel.
Note that the “what-if analysis” function I’m describing can only calculate a 2-variable sensitivity analysis, and I simply make 3 “what-if analysis” tables in order to turn this analysis into a 3-variable one.
I find it’s the easiest way I could find to run the type of sensitivity analysis I’d like, especially since FCF estimates are really “less sensitive”—in the sense that I prefer a range of FCF estimates but am not picky about a 1-2 percentage point swing like I would be a growth rate or discount rate.
2-Variable Sensitivity Analysis Table in Excel (10y FCF and Terminal Growth Rate)
Let’s go back to the table titled FCF – mid, and create that first.
The first step is to denote what the final value that our “what-if analysis” table is trying to calculate. In this case, I’m not calculating FCF – lower or FCF – higher, so I only take the DCF calculation for FCF – mid (or “Total Present Value”).
Simple enough, it looks like this:
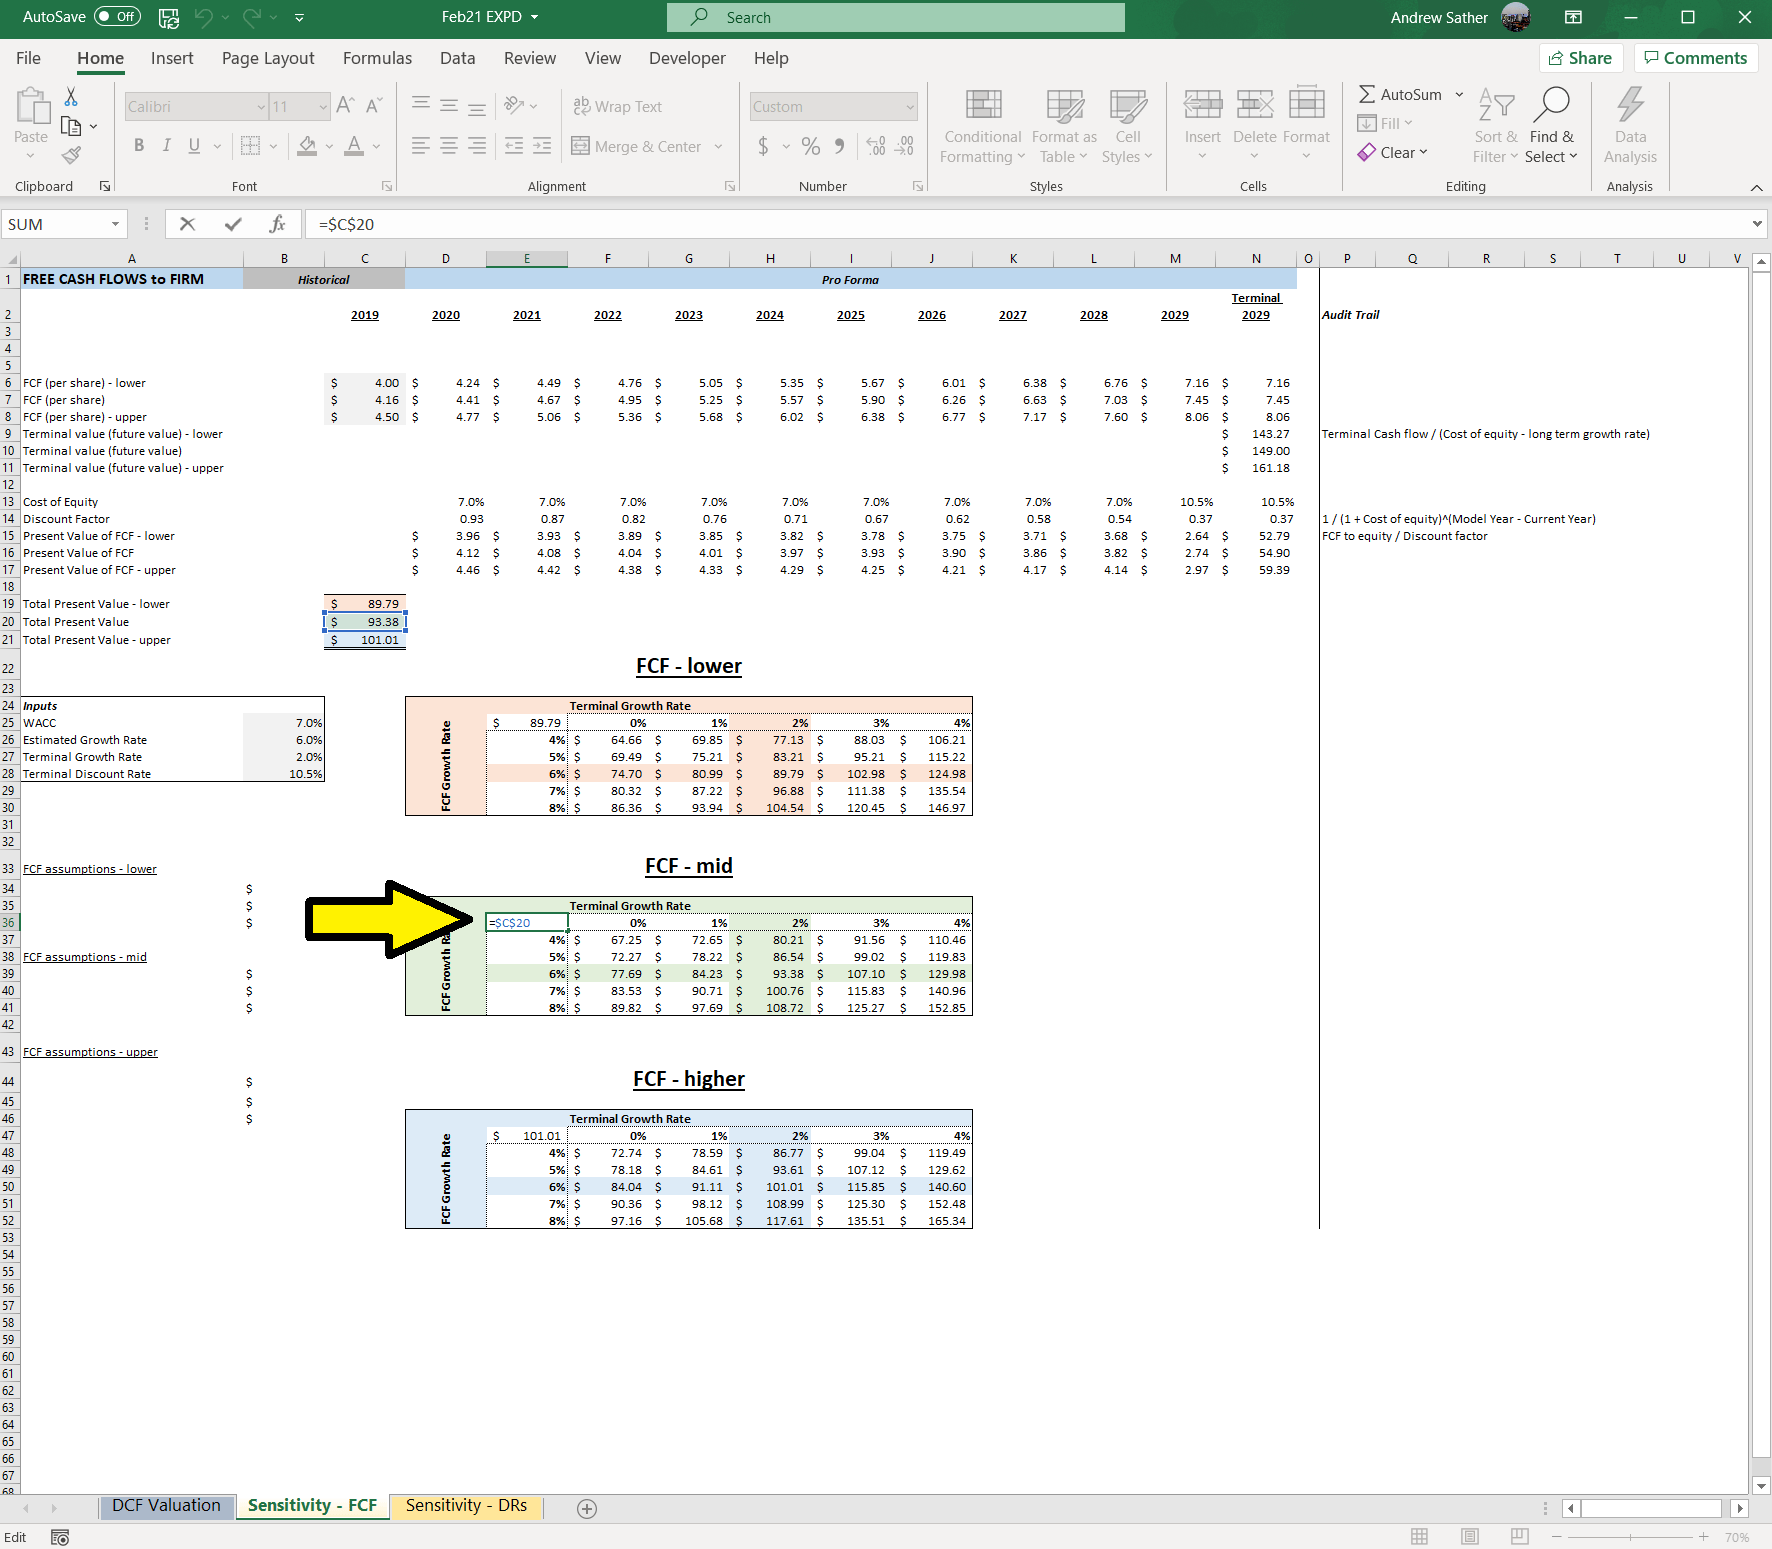
Next you want to create a row of inputs which you’d like to run sensitivity on. In my case, I wanted to vary the Terminal growth rate from 0% – 4%, which I inputted into cells “F36:J36”.
You also want to create a column of inputs which will also vary for your 10y FCF growth rate, in my case this was cells “E37:E41”, from 4% – 8%.
Edit this row and column as you please, you most definitely don’t have to stick to my ranges just because that’s what I did for this particular company.
Now’s the fun part.
Select the table you want these values to output into. For me that’s “D36:J41”. Then click on the Data table at the top of Excel, Click on “What-if Analysis”, and click “Data Table…”:

The function will prompt you with two options, which you will input as the two variables which are being adjusted and calculated for. We want that Terminal Growth Rate row, F36:J36, to fill-in for our Terminal Growth Rate in the model (which is B27), so we enter “B27” for the “Row input cell:”.
Same thing for our FCF growth rate; put the B26 cell into the “Column input cell:” field so that our selected column (E37L:E41) will be inputted into Estimated growth rate to spit out different final intrinsic values.
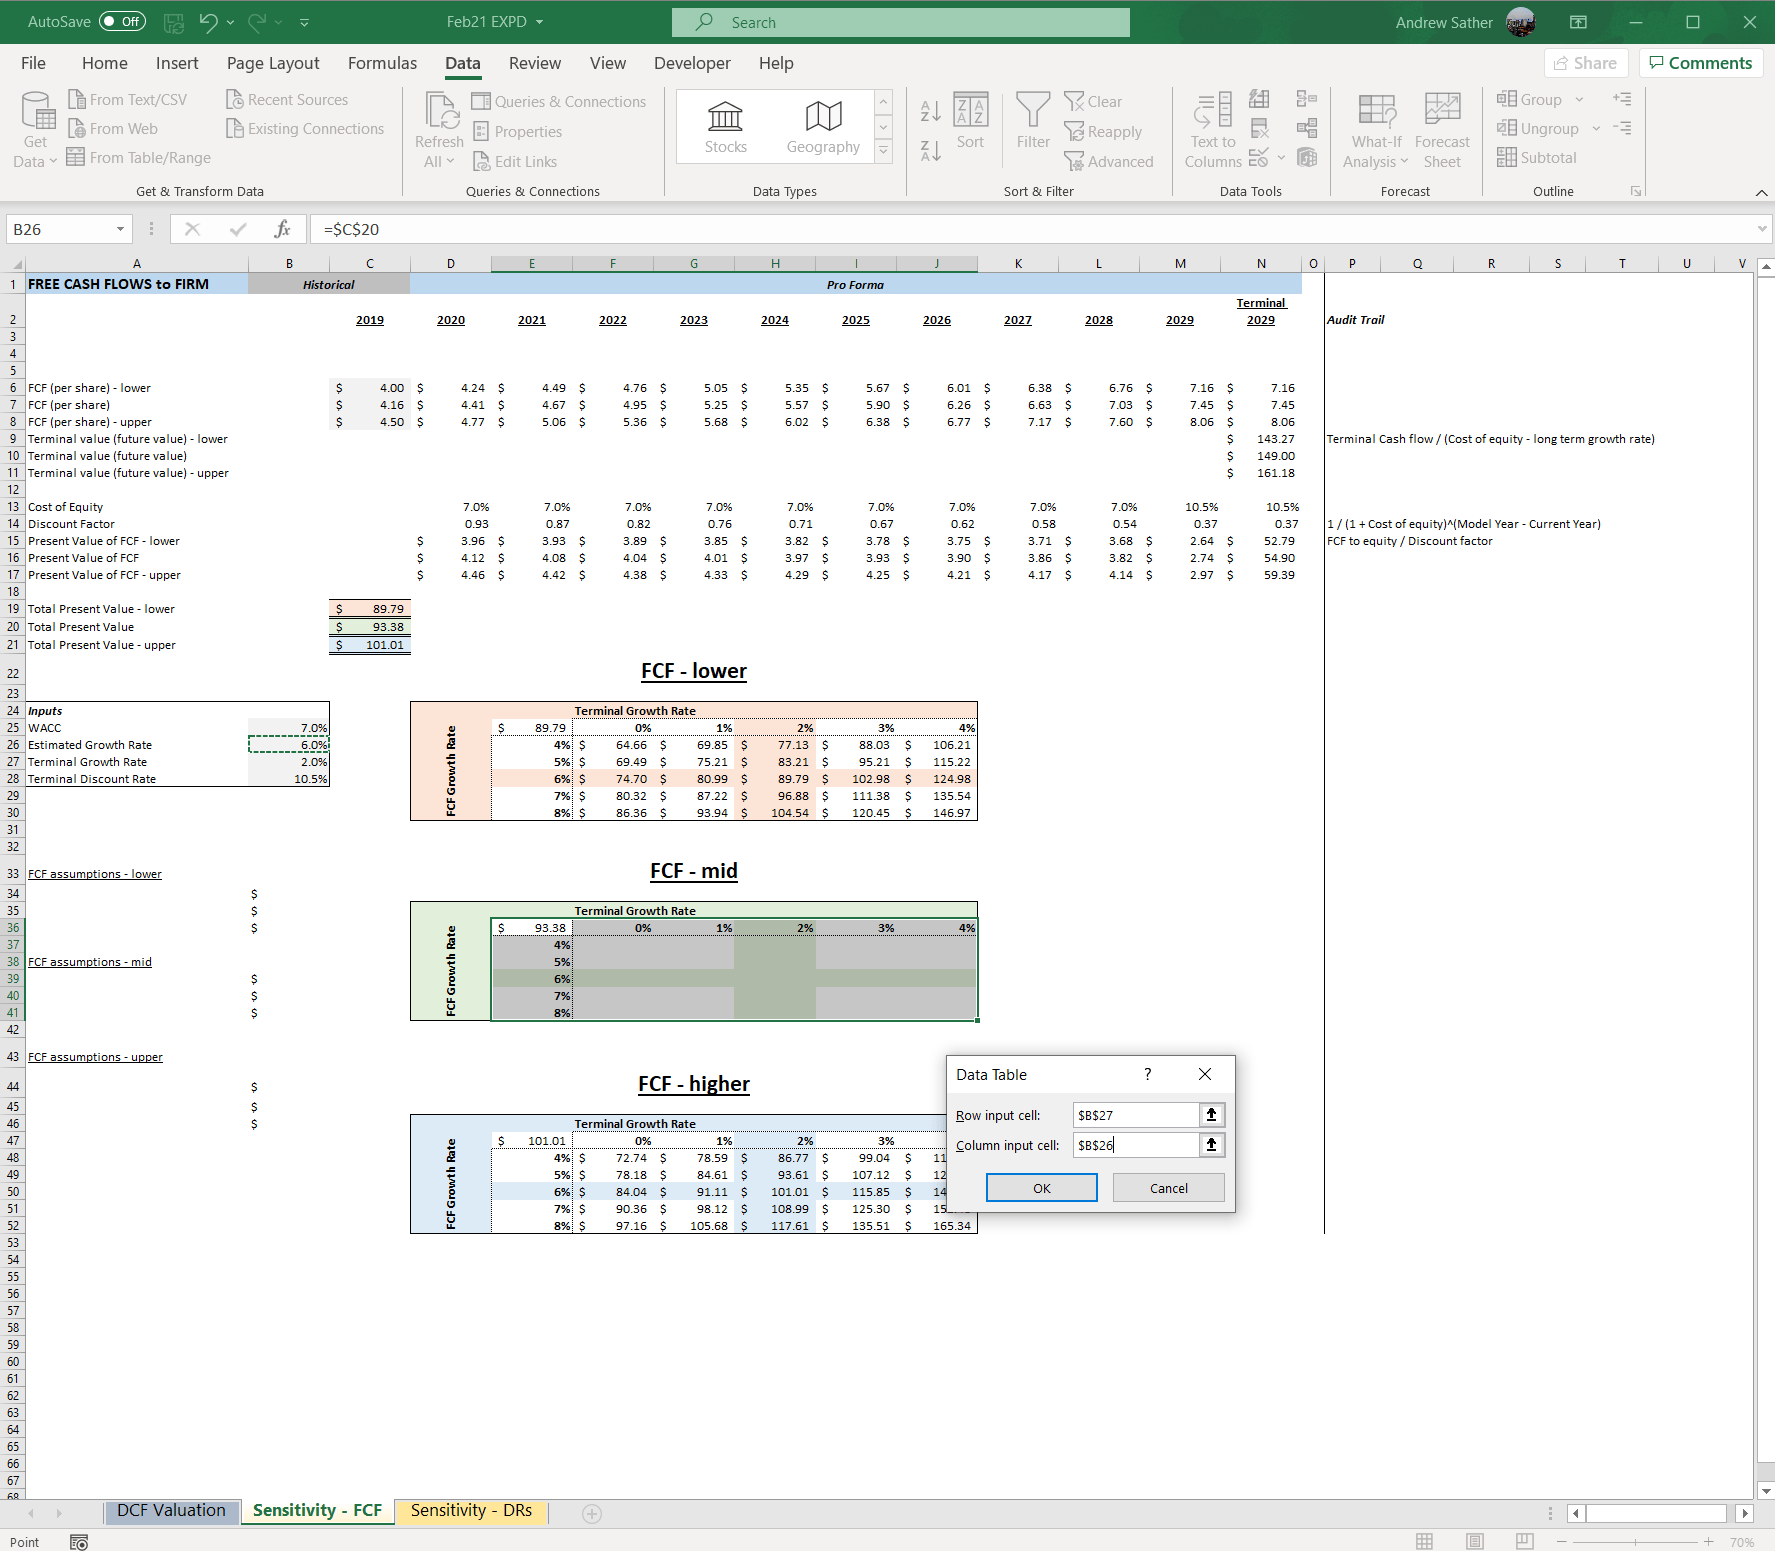
After that, voilà!! Excel should’ve worked its magic, and we should have a full DCF sensitivity analysis with variance in terminal growth rate estimates and FCF growth rate estimates.
You can check your work by verifying that the center output (H39) matches the same output for the DCF which was calculated before you created the sensitivity table (C20).
2-Variable Sensitivity Analysis Table in Excel (Discount Rates, TV Discount Rates)
The exact same process can be used to add variance to your discount rate inputs as you did with the growth rate inputs. In this case, you would create the same type of table but with edited rows and columns to represent the new inputs you want to test.
In my case, I wanted to analyze my constant 10y discount rate (or WACC) and also my terminal discount rate. For me it looked like the following:

You don’t have to make a What-if Analysis table using just growth rates or just discount rates—in fact, you can mix the two.
It’s all up to what assumptions you’re trying to test and at what ranges.
Putting it all together (the 3-variable Sensitivity Analysis)
Not only should a good DCF valuation have a sensitivity analysis on your growth and discount rate inputs, but it’s probably a good idea to vary the FCF/ share estimates as well—especially since a company is likely to have variance in these cash flows over time.
Some of this has to do with the regular year-to-year changes in working capital as a business operates, or FCF/earnings could be impacted greatly due to one-time factors (or the economic cycle).
Note that you could also normalize FCF/share estimates over multiple years instead of just taking a snapshot in time as another substitute to account for the variance in FCF, which would remove the need for this 3rd variable in this special case.
I liked the idea of having a low range, mid range, and high range FCF estimate for my DCF sensitivity analysis model—and then presenting it in 3 separate “What-if” tables to visually see the impact.
The Big Investor Takeaway
Hopefully, in the course of building a sensitivity model like this you see the vast possibilities of estimated intrinsic value that can occur from a DCF, and how a DCF valuation can really be tweaked to fit a narrative by small, seemingly insignificant changes in inputs.
It’s a big reason why I’m so passionate about finding companies trading with a margin of safety, emphasis on the safety, because there’s a good chance I’m missing something in my assumptions which greatly impacts my final valuation estimates.
By being conservative, I’m more likely to still receive a decent return on my investment even if my growth or discount rate estimates are off by a few percentage points, because that margin of safety has provided a cushion to the difference between the price I paid and what the asset is really worth.
Again, I can’t stress enough how having a good DCF valuation spreadsheet is critical to completely understanding the overall valuation you are coming up with.
I haven’t seen a tool that’s as simple, elegant, and useful as Cameron’s IFB Equity Model in doing just that, and recommend you get a copy for yourself.

Andrew Sather
Andrew has always believed that average investors have so much potential to build wealth, through the power of patience, a long-term mindset, and compound interest.
