If you are a human, you’re likely wondering when the heck is,
we going to get to the bottom of this bear market, and I don’t blame you,
because every sane person should be wondering this. Don’t worry – I’ve gone through the trouble
fun of looking at some of the past bear markets to lay out some common market
bottom indicators!
Honestly, I have never really cared enough to look into some of the market bottom indicators because in my eyes, that’s definition of trying to time the market. And not only does timing the market not work, but it really doesn’t even matter.
I have always focused on finding companies that are undervalued vs. their intrinsic value and I always will continue to focus on that, but let’s be honest, you will find those values much more frequently in a market downturn and when the market hits the bottom and starts to rebound, those scenarios will slowly start to become less and less frequent.

So, do I care when the market bottoms? Kinda? I do care when I can find companies for great value, though, so in a way, it is somewhat the same thing.
Tomato, tomato; Potato, potato. I’m realizing now that this doesn’t work as well when I type it out instead of annunciating tomato and potato differently, signifying that it’s the same thing.
How about this – 6 in one, half a dozen in the other. There – much better.
Admittedly, I am not a huge technical trader…like at all. I don’t really worry about the technical at all, but when I was looking up some of the past bull markets, it was very interesting to see two things stick out to me that were technicals, but not too hard to comprehend:
Watching the VIX
The VIX, or Volatility Index, measures a 30-day outlook for the volatility of the stock market. The average VIX is typically between 18-35 but can get much lower and then much, much higher, depending on the volatility of the market and the people that are trading in it.
I won’t bore you by getting super into the details of the VIX, but the general takeaway is that the higher it is, the higher the volatility. The higher the volatility, the more sporadic the stock market is and the more likely it is for crazy things to happen. And trust me, the proof is in the pudding.
Below I have two different screenshots from Yahoo Finance that track the VIX since 1990 to show how things have trended.
A quick side note is that Yahoo Finance is a great platform for quick, high-level data. If you haven’t played around with it, I recommend you give it a shot. I love to use it for quick updates on my stocks and watchlists, news on those stocks, and then high level data like the more common ratios such as P/S, P/B, P/E, dividend yield, and then the ability to easily decipher historical pricing.
It’s not great for anything more than that, but if you haven’t tried it, I recommend you give it a shot.
Ok, back to the VIX – the charts below show the VIX since 1990:
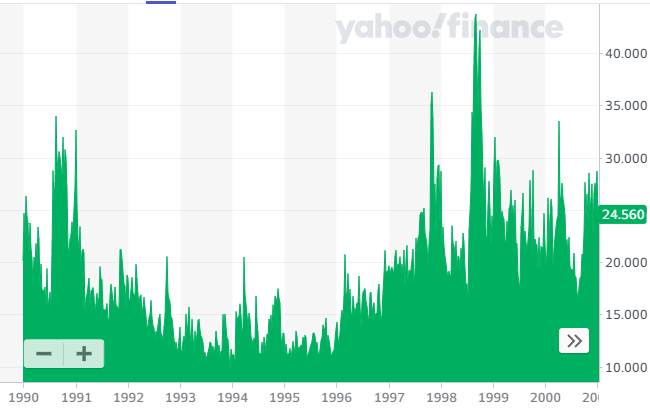
I see two really major spikes here, one in the 1990s and then another in the late 1990s. Any idea what happened during those timeframes?


Crazy, right? Now, of course the VIX isn’t always an indicator that something tragic is coming, and sometimes a higher VIX is simply something that occurs during a downturn, so it’s not always as easy as following the VIX to predict the next downturn.
Below is another chart, showing from 2000 – current – what do you think happened in these two major spikes ?
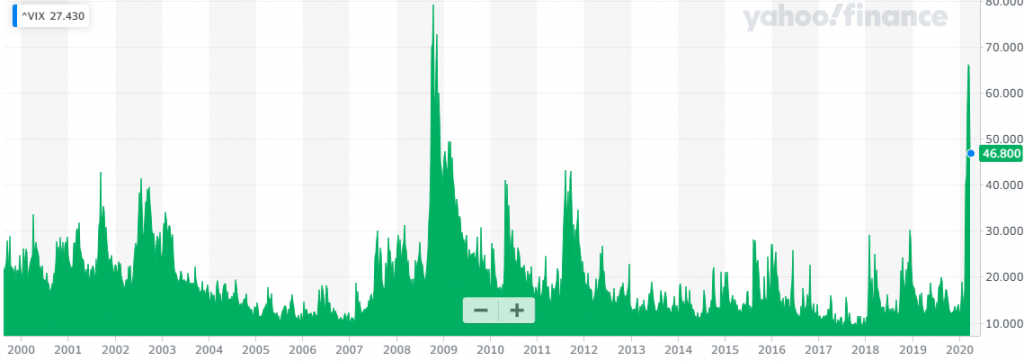
Yep, it’s the 2008 crash and then the coronavirus pandemic that we’re currently going through. But, as you can see, those spikes are short-lived, and then the VIX returns to more normal-ish type levels. I wanted to zoom in a bit on what we’re experiencing right now, and that is shown below:

As you can see, the VIX is slowly starting to come back down from the high in the mid-60’s. It’s definitely still very high, indicating high levels of volatility and trading, but things are slowing down a bit from a few weeks ago in mid-March when we had 6 straight days of trading that was a 4% change, either up or down, from the open to close price.
Some people call the VIX the “Fear Index” but I think that I would think of it more of just an indicator of things to come.
In addition to understanding the VIX, there was another potential indicator that I thought was very interesting, and it’s something that I’ve looked at before but never too in depth:
Tracking Performance vs. a Moving Average Using a Mean Reversion Strategy
Admittedly, I feel like this should’ve been more of a ‘duh’ to me than it was, because I do look at moving day averages quite frequently just to see how things are trending.
In a previous post I wrote a blog about how using a 90-day moving average can really result in some major gains as long as you have a plan and stick to it.
One of the most important parts of this plan, and honestly is with any stock plan, is to stick to it. If you bail when times are hard then you’re going to severely limit yourself because usually, the harder the times are, the more likely the opportunity for you to experience major gains.
IN general, people usually feel that if a stock breaks the 50-day moving average and goes lower then the stock is bearish, while if it breaks out and goes higher then it’s bullish. If the stock hits that 50-day moving average and bounces back either way, then it’s either going to likely remain a bull or bear for the long-term as that was a point of trading resistance…or so that’s how the traders will utilize this strategy.
In the chart below from Yahoo Finance you can see how I tracked the S&P 500, along with the 50-day moving average and the 200-day moving average (which you can do simply by clicking that Indicators button that I am showing below):
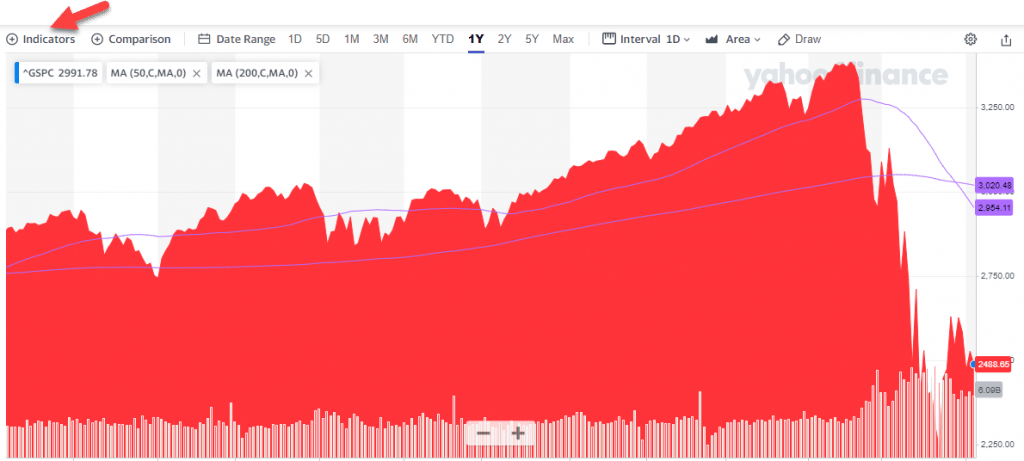
As you can see, the S&P 500 dropped below the 50-day moving average fairly recently on 2/24, and then a quick 3 days later on 2/27, the S&P dropped below the 200-day moving average. Essentially, the downturn was so fast and rapid that it blew through both of those levels so incredibly fast and continued to drop, therefore meaning that you should be bearish on the S&P, right?
A very interesting phenomenon is that about a month later, on 3/27, the 50-day average dropped below the 200-day average, meaning that this drop off has been so hard and likely will continue. This is referred to as a death cross while when the exact opposite happens and the 50-day moving average crosses the 200-day moving average in a move above it, that is called a golden cross, meaning good things are on the horizon!
So, what does all of this mean to you as the investor? It means that you can get a good feel for how the market is trending and at the same time, get a feeling for the sentiment that others have towards the market. Just as it’s very important for you to know how you feel about the market, specific stocks, and to have faith in your analysis, it is also very important to understand how others are viewing the market as well.
At the end of the day, companies stock prices are not actual indicators for what the company is truly worth – they are simply what the public is willing to pay for 1, 2, 500 or 20,000 shares at that point in time. That fluctuates based off of the news of the company, the results of the company, and quite honestly, just how the public might feel about the company, like when Peloton had an advertisement that could’ve been perceived as sexist and it caused the share price to sell off 10%.
Understanding the sentiment of the public can help prepare you better for what to expect, and better yet, how to take advantage of each and every situation in the market, which brings me to me last point!
Assessing the Market Sentiment
If you haven’t heard of Tobias Carlisle, you need to check him out. I put him on my list of ‘Super 6’ List of Deep Value Investing Thought Leaders and I think that the way that he thinks about things is profound. Andrew and Dave also had them on the podcast which is how I got my first exposure to Carlisle but have been hooked quickly, as you can see below that I am a Twitter follower.

The main takeaways that I had with the podcast and then listening more to Carlisle is to ‘zig when others zag’ or in essence, don’t blindly follow others for no good reason. The tweet above from Carlisle is saying exactly that.
If everyone is thinking the market is going to go deeper, then there is a big opportunity for you to truly prosper by getting in now. Try to listen to what people say and then just play devil’s advocate for a bit, even if you do believe what they’re saying.
If everyone thinks one thing, think the opposite. Make yourself do it. You’ll be better for it.
The sentiment of the market has turned to negative that people just assume that we’re going to keep going lower and lower. I mean, I listen to Fast Money almost every single morning while I am working out and getting ready for work, amongst a wide variety of other podcasts, but all of the hosts on Mad Money, and I literally mean all of them, say that they feel the market has reached ‘a’ bottom but not ‘the’ bottom, so you can trade the volatility now but to expect another bottom before the coronavirus pandemic is over.
It became such an assumed thing to me from hearing it from them so often that I just felt like it was a foregone conclusion. Do I think we’ve reached the bottom? Honestly, I kind of do. I think that there has been so much bad news already baked into the market that I think that things really won’t get much lower, even after earnings, as so many companies have withdrawn their guidance.
Honestly, if Carlisle hadn’t tweeted that and I hadn’t seen it, I don’t think that I actually would’ve ever really questioned what I kept hearing over, and over, and over again, and instead might’ve been waiting for a bottom that never came.
While I might be completely wrong, if I am wrong, I am wrong based off of my analysis and my assumptions rather than just listening to some people on CNBC, and I can take a ton of peace of mind in that alone.
Each one of these strategies can be used when you’re trying to find a market bottom, and likely all three should be used, in addition to many, many other things.
But at the end of the day – who cares where the market bottom is?
You cannot predict it.
But, if you can predict it maybe in a general range, or even predict when things might be going a little lower, then that could give you some major, major advantages in your investing journey.
Of course, this is teetering the line of market timing, and trying to find a bottom absolutely is market timing, but if you were to be able to see trends by using the VIX, tracking the 50-day and 200-day moving averages, and understanding the sentiment of others in the market, then it could set you up for long-term success.
Take these tips and try to use them. Maybe you don’t find the bottom, but if you can see something that keeps you from investing for a 10% gap of a downturn, and then you continue to dollar cost-average after that, then you just made 10% on all of those funds that you would’ve invested but chose not to due to these tips.
The most important takeaways are these:
- You can’t time the market bottom perfectly
- You can identify moments of time to “hold off” on dollar cost averaging as long as you understand the risk
- You can think contrarian of others and set yourself up for major gains
- And most importantly…you CAN beat the market as long as you have a winning game plan and you stick to it!
